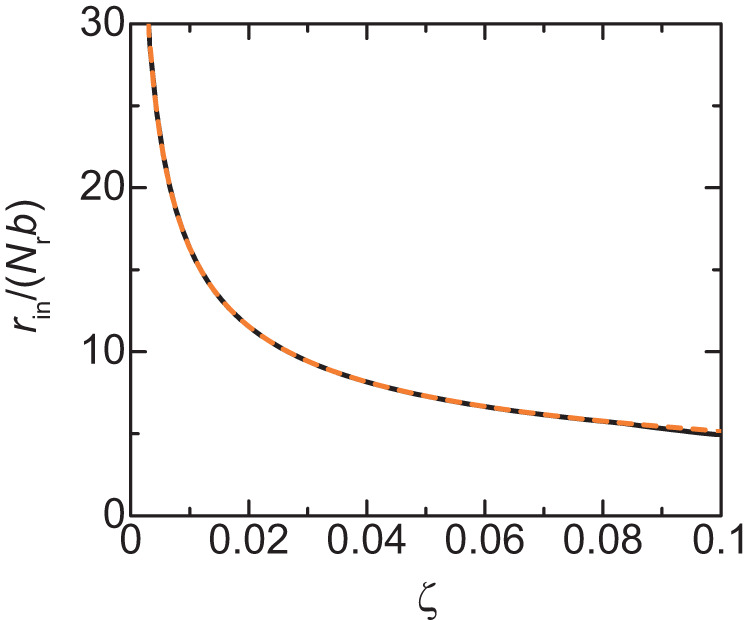
Fig. 6. Radius rin of FCs vs. rescaled transcription rate ζ.

The radius of FCs at the free-energy minimum is shown as a function of rescaled transcription rate ζ. The solid dark green line is derived by numerically calculating Supplementary equations (S13), (S15), and (S16) with the condition that the volume fraction of solvent is zero and the occupancy of the terminal regions of pre-rRNAs by RBPs is unity. The orange broken line is derived by using Eq. 5. The parameters used for the calculations are summarized in Table 1.
