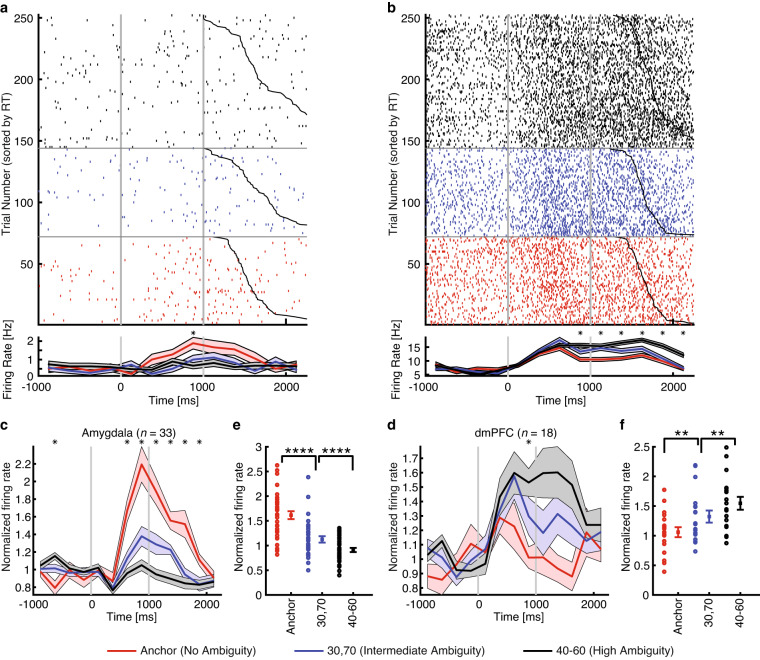
Fig. 5.
Single-neuron results. (a) An example amygdala neuron that fire most to unambiguous faces and least to the most ambiguous faces (linear regression: P < 0.05). (b) An example dorsomedial prefrontal cortex (dmPFC) neuron that fire most to the most ambiguous faces and least to unambiguous faces (linear regression: P < 0.05). Raster (top) and PSTH (bottom) are color coded according to ambiguity levels as indicated. Trials are aligned to face stimulus onset (left gray bar, fixed 1 s duration) and sorted by reaction time (black line). PSTH bin size is 250 ms. Shaded area and error bars denote ± SEM across trials. Asterisk indicates a significant difference between the conditions in that bin (P < 0.05, one-way ANOVA, Bonferroni-corrected). (c, d) Average normalized firing rate of ambiguity-coding neurons. Asterisk indicates a significant difference between the conditions in that bin (P < 0.05, one-way ANOVA, Bonferroni-corrected). (e, f) Mean normalized firing rate at ambiguity level. Normalized firing rate for each unit (left) and mean ± SEM across units (right) are shown at each ambiguity level. Mean firing rate was calculated in a time window 250 to 1750 ms after stimulus onset (the same time window as neuron selections). Asterisks indicate a significant difference between conditions using paired two-tailed t-test. **P < 0.01 and ****P < 0.0001. (c, e) Neurons in the amygdala that increased their firing rate for the least ambiguous faces (n = 33). (d, f) Neurons in the dmPFC that increased their firing rate for the most ambiguous faces (n = 18).

