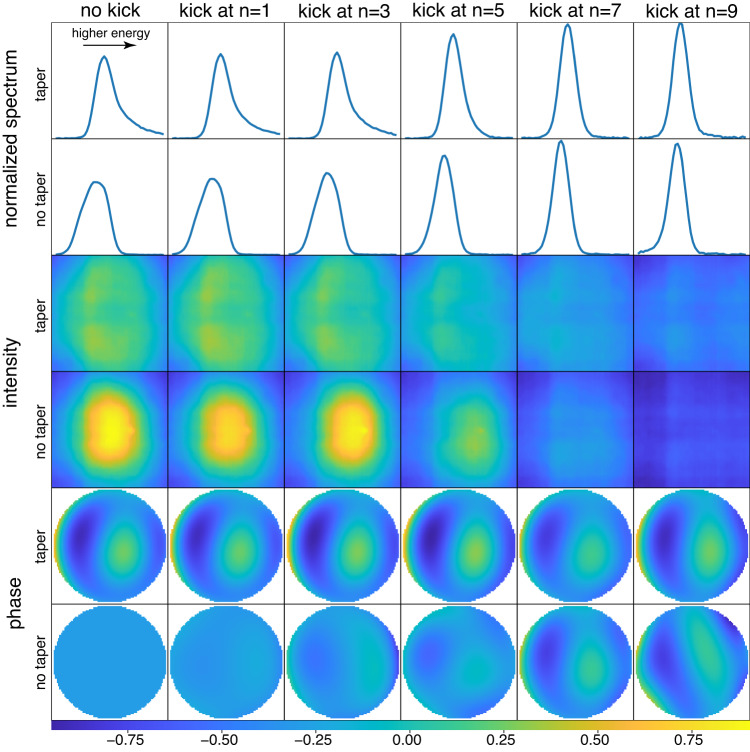
Fig. 2. X-ray spectra and wavefronts for different kicking locations and tapers.
The X-ray wavefront and spectrum were measured for various operating configurations, and each subplot displays the average measurement result of a particular case. The six columns correspond to six different kicking positions along the undulator, with n = 0, 1, 3, 5, 7, and 9 sections before the final undulator section, where 0 indicates no kicking. The six rows are grouped into three categories, displaying the normalized X-ray spectra, wavefront intensities, and phases, respectively. Within each category, the two rows show the results with and without undulator taper, respectively. The color bar at the bottom is only applicable to the phase maps. The wavefront phase plots have had the defocus and astigmatism terms removed and used the no taper no kick case as the reference to enhance the illustration of high-order phase differences. It is evident to see the differences in spectrum, wavefront intensity, and phase among cases. Please note that all plots are displayed in pixel units and are not calibrated to energy or length units due to experimental limitations during the run. For the purpose of this study, they are not required, but it would be desired for future studies.

