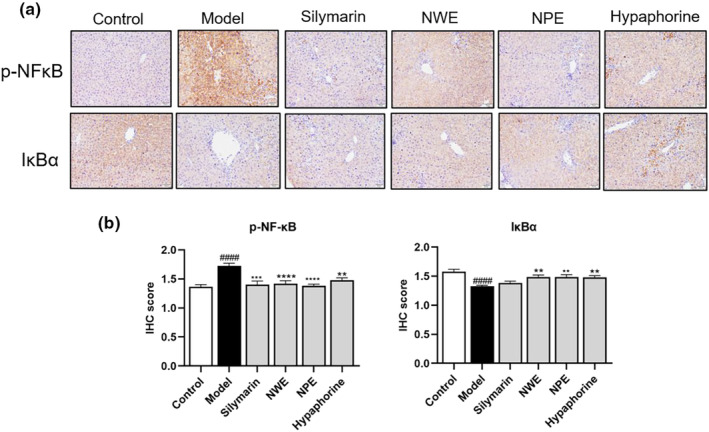
FIGURE 4.

Immunohistochemical staining with p‐NF‐κB and IκBα in the liver tissues of CCl4 treated mice. Representative IHC images of tissue sections showing in situ expression of p‐NF‐κB and IκBα (a). Quantification of p‐NF‐κB and IκBα levels (b). Data are expressed as mean ± SEM of at least three independent experiments (n ≥ 5). ### p < .001 and #### p < .0001 compared to the control group; *p < .05, **p < .01, ***p < .001, and ****p < .0001 compared to the model group.
