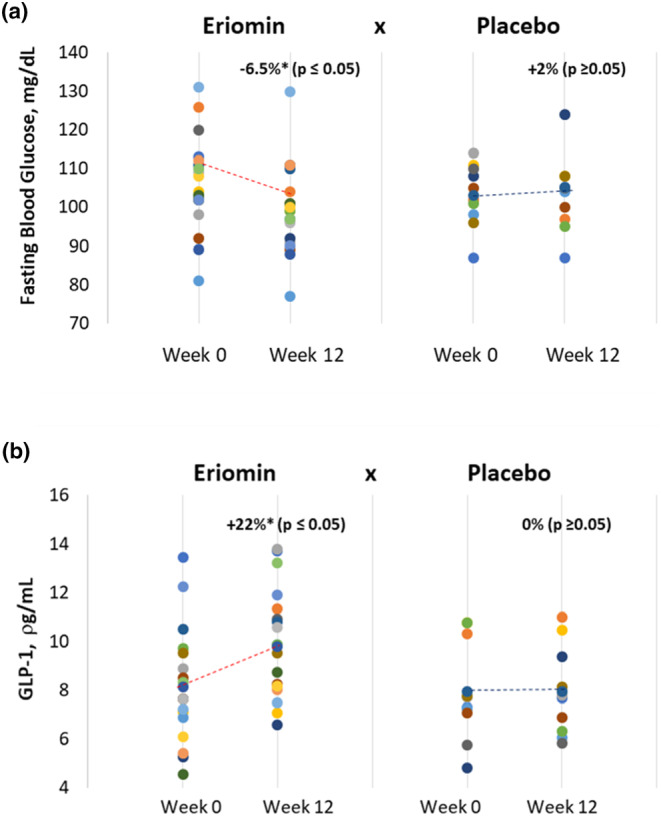
FIGURE 2.

Course of (a) blood serum glucose (mg/dL) and (b) GLP‐1 over 12 weeks of treatment (Week 0 and Week 12) with 200 mg/day of Eriomin versus Placebo in prediabetes patients. Circular points represent individual measurements of Glucose (a) and GLP‐1 (b). Dash line represents the average trend line over time.
