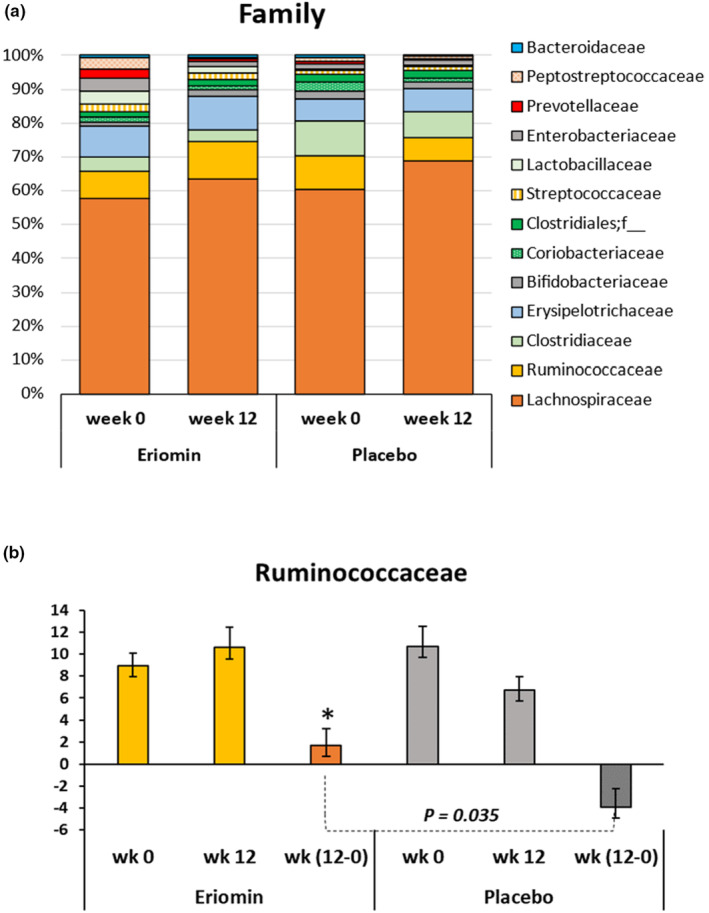
FIGURE 4.

(a) Distribution of the main microbial families before (week 0) and after (week 12) treatment with Eriomin® or Placebo. Data are expressed as percentage of relative abundance by group mean (Eriomin® or Placebo) in each experimental period. (b) Changes in the abundance of the Ruminococcaceae family after 12 weeks of Eriomin® treatment. Values are expressed in OTU. The increment of Ruminococcaceae with Eriomin® versus the decrease after Placebo is statistically significant (p ≤ .035).
