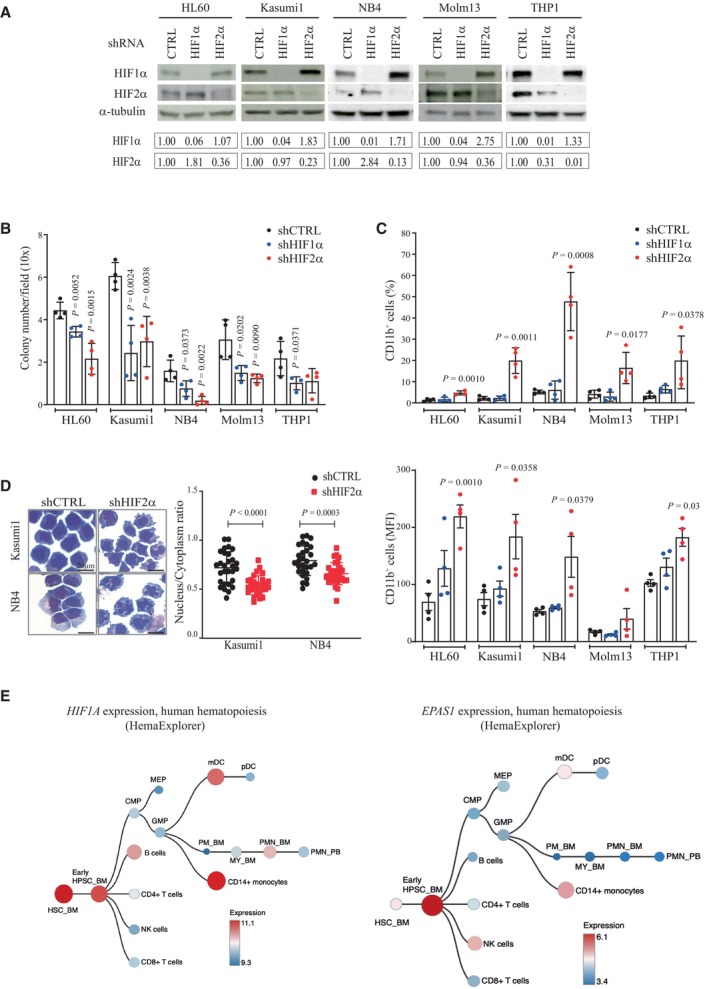
Figure 1. HIF2α silencing induces AML differentiation.

- Immunoblot analysis showing silencing efficiency of shRNAs against HIF1α, HIF2α, or a scrambled shRNA as control (shCTRL) in five AML cell lines at early passages upon retroviral infection (P5‐10). α‐tubulin was used as loading control. Densitometric analyses in the bottom boxes show relative levels of HIFα factors over control cells. Data are representative of one out of three independent experiments.
- Colony forming capacity of indicated AML cell lines expressing shHIF1α, shHIF2α, or shCTRL. Shown is the average number of colonies/field in 20 fields (10× objective). Data represent mean ± SD of four biological replicates (Student's t‐test).
- Upper panel: Percentages of AML cells expressing the myeloid differentiation marker CD11b upon HIFα‐specific silencing in the indicated cell lines. Lower panel: mean fluorescence intensity (MFI) of CD11b in the indicated cell lines. Data represent mean ± SD of four biological replicates (Student's t‐test).
- May‐Grunwald Giemsa staining of shCTRL and shHIF2α Kasumi1 and NB4 cells. Scale bar, 20 μm (40× objective). Data are representative of one out of three independent experiments. Dot plots on the right indicate nucleus/cytoplasm ratio of shCTRL and shHIF2α Kasumi1 and NB4 cells, with each dot representing a single cell (n = 30, mean ± SD, Student's t‐test). Areas of nucleus and cytoplasm were calculated using ImageJ software.
- Hierarchical hematopoietic trees showing expression of HIF1A and EPAS1 genes in normal human hematopoiesis using HemaExplorer dataset (data obtained from BloodSpot; Bagger et al, 2016).
Source data are available online for this figure.
