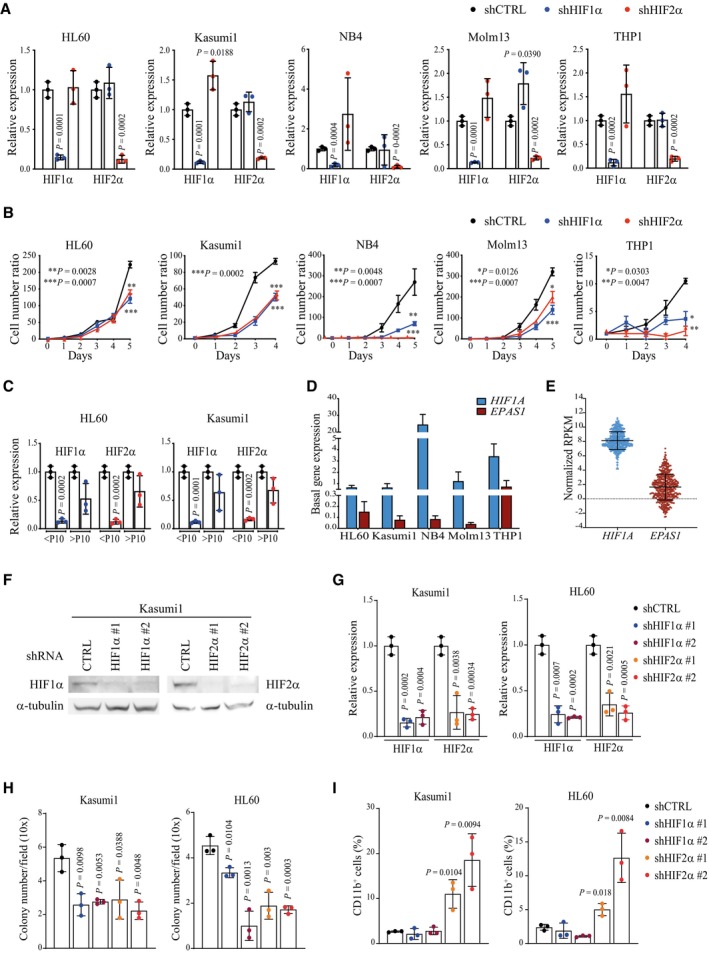
qPCR analysis of HIF1α and HIF2α in the indicated AML cell lines stably expressing shRNAs against HIF1α or HIF2α or a scrambled shRNA as control (shCTRL). Data are expressed as fold change in HIFα‐silenced cells compared to shCTRL cells. Data represent mean ± SD of three biological replicates (Student's t‐test).
Cell proliferation of the indicated AML cell lines carrying shHIF1α, shHIF2α, or shCTRL. Values represent cell numbers normalized over day 0. Data represent mean ± SD of three biological replicates (Student's t‐test).
qPCR analysis of HIF1α and HIF2α in HL60 and Kasumi1 cells stably expressing shCTRL, shHIF1α or shHIF2α. Data are expressed as fold change in HIFα‐silenced cells compared to shCTRL cells. Data represent mean ± SD of three biological replicates of cells at passages 4–10 (< P10) or passages 11–16 (> P10) (Student's t‐test).
Analysis of HIF1A and EPAS1 (encoding HIF1α and HIF2α respectively) basal expression in the human AML cell lines utilized in this study. Data represent mean ± SD of three biological replicates.
mRNA expression of
HIF1A and
EPAS1 in 451 AML patients from the Oregon Health & Science University (OSHU) dataset (Tyner
et al,
2018). Data are expressed as normalized RPKM (Reads Per Kilobase Million), and were obtained from the cBioportal database (Cerami
et al,
2012). Data represent mean ± SD of 451 biological replicates.
Immunoblot analysis showing silencing efficiency of two independent shRNAs against HIF1α (shHIF1α#1 and shHIF1α#2) and HIF2α (shHIF2α#1 and shHIF2α#2), or a scrambled shRNA as control (shCTRL) in Kasumi1 cells. shHIF1α#1 and shHIF2α#2 are shRNAs utilized in the main figures. α‐tubulin was used as loading control.
qPCR analysis of HIF1α and HIF2α upon HIFα‐specific silencing and compared to shCTRL in Kasumi1 (left graph) and HL60 (right graph) cells. Data represent mean ± SD of three biological replicate (Student's t‐test).
Colony forming capacity of Kasumi1 (left graph) and HL60 (right graph) cells expressing shHIF1α#1, shHIF1α#2, shHIF2α#1, shHIF2α#2, or shCTRL. Shown is the average number of colonies/field in 20 fields (10x objective). Data represent mean ± SD of three biological replicates (Student's t‐test).
Percentages of CD11b+ in cells described in (H). Data represent mean ± SD of three biological replicates (Student's t‐test).

