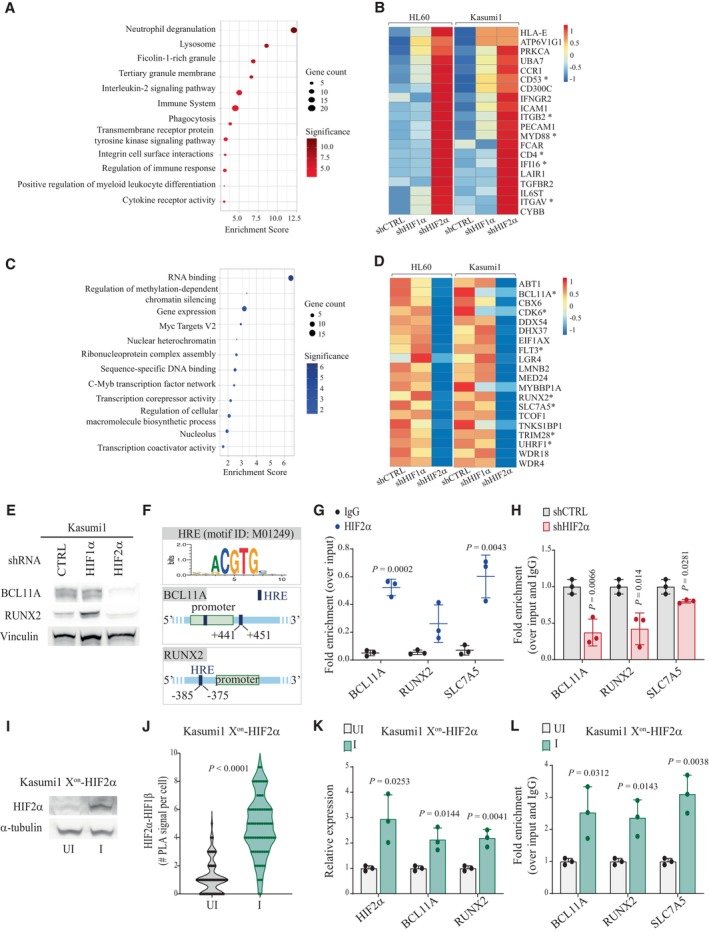
Figure 2. HIF2α suppresses expression of myeloid differentiation genes and promotes transcriptional repressors and leukemogenic factors.

-
A–D(A, C) Gene set enrichment analysis of differentially expressed genes (DEGs; significant threshold of 0.05, adjusted P‐value by False Discovery Rate) commonly upregulated (A) and downregulated (C) in HL60 and Kasumi1 cells upon HIF2α silencing. Indicated are the terms most significantly enriched in the following libraries: gene ontology (GO) biological process, GO molecular function, GO cellular component, Bioplanet, Reactome, and Hallmarks of cancer. Dot sizes represent the number of genes in each term, and colors indicate Enrichment Scores expressed as −log10 (P‐value). (B, D) Heatmaps of commonly upregulated (B) and downregulated (D) genes within the terms most significantly enriched. The red‐blue color scale reflects normalized RPKM (Reads Per Kilobase Million), with red indicating genes with higher expression and blue indicating genes with lower expression. Asterisks indicate genes that are mentioned in the main text. Results for each cell line represent the average of two independent experiments.
-
EImmunoblot analysis of BCL11A and Runx2 upon HIFα‐specific silencing in Kasumi1 cells. Vinculin was used as a loading control. The blot represents one out of three independent experiments with similar results.
-
FSchematic view of HREs location in the regulatory regions of BCL11A and RUNX2 genes. HREs positions are numbered relative to annotated promoters (green boxes). HRE consensus sequence was obtained from MotifMap (motif ID: M01249).
-
GChIP‐qPCR for HIF2α with primer pairs amplifying the HREs of BCL11A and RUNX2 and the positive control SLC7A5 gene in Kasumi1 cells. IgG was used as negative control. Results are represented as percentage of enrichment over input and represent mean ± SD of three biological replicates (Student's t‐test).
-
HChIP‐qPCR for HIF2α with primer pairs amplifying the HREs of BCL11A and RUNX2 and the positive control SLC7A5 gene in shCTRL and shHIF2α Kasumi1 cells. Data were normalized over input and control IgG and presented as fold enrichment over control cells. ChIP‐qPCR data represent mean ± SD of three biological replicates (Student's t‐test).
-
IImmunoblot analysis of HIF2α upon induction of exogenous HIF2α expression in Kasumi1 cells transduced with the Xon system. UI: uninduced cells; I: induced cells. α‐tubulin was used as a loading control. The blot represents one out of two independent experiments with similar results.
-
JProximity ligation assay with HIF2α and HIF1β antibodies in Kasumi1 cells transduced with the Xon system. UI: uninduced cells; I: induced cells. Numbers of nuclear interaction foci/cell are represented (n = 80, three independent experiments, Student's t‐test).
-
KqPCR analysis of the indicated genes in Kasumi1 cells transduced with the Xon system. UI: uninduced cells; I: induced cells. Values are represented as fold change in gene expression compared to uninduced cells. Data represent mean ± SD of three biological replicates (Student's t‐test).
-
LChIP‐qPCR for HIF2α with primer pairs amplifying the HREs of BCL11A and RUNX2 and the positive control SLC7A5 gene in Kasumi1 cells transduced with the Xon system. UI: uninduced cells; I: induced cells. Data were normalized over input and control IgG and presented as fold enrichment over control cells. Data represent mean ± SD of three biological replicates (Student's t‐test).
Source data are available online for this figure.
