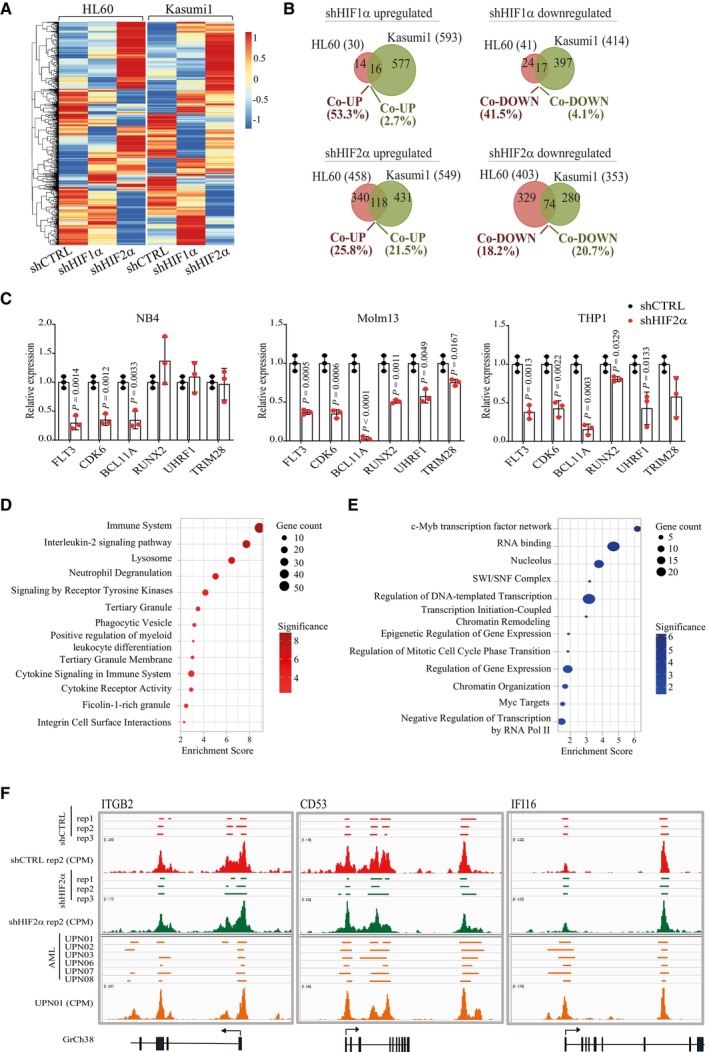
Figure EV2. Global changes in gene expression, H3K27me3 and chromatin accessibility upon HIF1α or HIF2α silencing in AML cells.

-
AUnsupervised hierarchical clustering of differentially expressed genes (DEGs) in HL60 and Kasumi1 cells following HIF1α or HIF2α silencing. A red‐blue color scale was used to reflect normalized RPKM, with red indicating genes with higher expression and blue indicating genes with lower expression. Each column represents the average of two independent experiments.
-
BVenn diagrams showing the number of DEGs commonly upregulated and downregulated in HL60 and Kasumi1 cells upon shHIF1α (top) or shHIF2α (bottom). Common/total deregulated genes in each cell line are indicated as percentages.
-
CqPCR analysis of the indicated HIF2α‐regulated genes in NB4 (left graph), Molm13 (middle graph) and THP1 (right graph) cells upon HIF2α silencing. Values indicate fold change in gene expression compared to shCTRL cells. Data represent mean ± SD of three biological replicates (Student's t‐test).
-
D, EGene set enrichment analysis of genes upregulated upon HIF2α silencing and showing unique H3K27me3 peaks in shCTRL (D) or downregulated upon HIF2α silencing and showing unique H3K27me3 peaks in shHIF2α (E) Kasumi1 cells. Indicated are the terms most significantly enriched in the following libraries: gene ontology (GO) biological process, GO molecular function, GO cellular component, Bioplanet, Reactome, and Hallmarks of cancer. Dot sizes represent the number of genes in each term, and colors indicate Enrichment Scores expressed as −log10 (P‐value).
-
FGenome browser view of normalized counts of ATAC‐seq profiles at the regulatory regions of the myeloid differentiation genes ITGB2, CD53, and IFI16. Open chromatin peaks of Kasumi1 cells are indicated in red for shCTRL and green for shHIF2α. Triplicate experiments and a representative alignment (normalized CPM values) of each condition are shown. Open chromatin peaks of six primary AML cells (obtained from GSE197416; Data ref: Gambacorta et al, 2022b) are indicated in orange and a representative alignment is shown. Lower panels represent the corresponding gene annotation from GrCh38 human reference.
