
Figure 3. HIF2α knockdown impairs leukemia progression and induces AML differentiation in vivo .
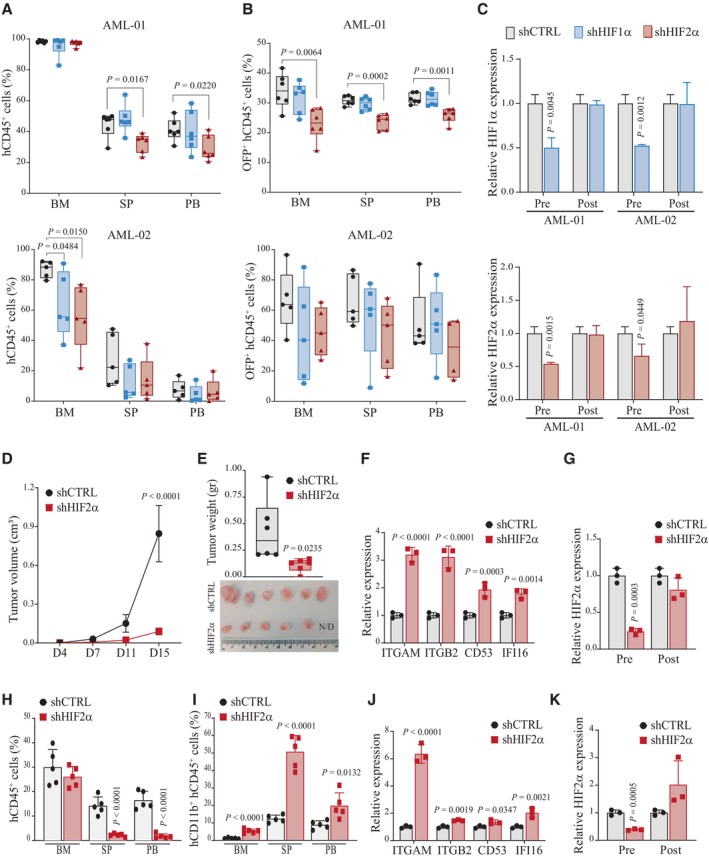
- Percentages of leukemic cells (hCD45+) in the bone marrow (BM), spleen (SP), and peripheral blood (PB) of mice injected with cells derived from AML‐01 (n = 6, upper panel) and AML‐02 (n = 5, lower panel) PDX and carrying shCTRL, shHIF1α, or shHIF2α. Data are represented in box and whisker plots where the central band denotes the median value, box contains interquartile ranges, while whiskers mark minimum and maximum values. All biological replicates are shown (n = 5/6, Student's t‐test).
- Percentages of leukemic cells expressing the OFP marker (OFP+hCD45+) in mice described in (A). Data are represented in box and whisker plots where the central band denotes the median value, box contains interquartile ranges, while whiskers mark minimum and maximum values. All biological replicates are shown (n = 5/6, Student's t‐test).
- qPCR of HIF1α (upper panel) and HIF2α (lower panel) genes in pre‐inoculated (Pre) AML‐01 and AML‐02 cells transduced with shCTRL, shHIF1α, and shHIF2α and in cells isolated from the bone marrow of transplanted mice at experimental endpoint (Post). Values indicate fold changes in gene expression compared to shCTRL cells. Data represent mean ± SD of three biological replicates (Student's t‐test).
- Tumor progression of Kasumi1 cells expressing shCTRL or shHIF2α injected subcutaneously. Tumor volumes were measured at indicated days (D) upon injection. Data represent mean ± SD of six biological replicates (Student's t‐test).
- Tumor weights of mice described in (D) at experimental endpoint (D20). Data are represented in box and whisker plots where the central band denotes the median value, box contains interquartile ranges, while whiskers mark minimum and maximum values. All biological replicates are shown (n = 6, Student's t‐test). Lower panel, photograph of excised tumors. N/D: not detected.
- qPCR analysis of the indicated representative myeloid differentiation genes in Kasumi1 shCTRL or shHIF2α tumors. Values are represented as fold change in gene expression compared to shCTRL. Data represent mean ± SD of three biological replicates (Student's t‐test).
- qPCR of HIF2α in pre‐inoculated (Pre) Kasumi1 shCTRL or shHIF2α cells and in cells isolated from Kasumi1 shCTRL or shHIF2α tumors (Post). Values indicate fold changes in gene expression compared to shCTRL cells. Data represent mean ± SD of three biological replicates (Student's t‐test).
- Percentages of leukemic cells (hCD45+) in the bone marrow (BM), spleen (SP), and peripheral blood (PB) of mice injected intravenously with Molm13 cells with shCTRL or shHIF2α and sacrificed at day 20 post‐injection. Data represent mean ± SD of five biological replicates (Student's t‐test).
- Percentages of Molm13 leukemic cells expressing CD11b (hCD11b+hCD45+) in mice described in (H). Data represent mean ± SD of five biological replicates (Student's t‐test).
- qPCR analysis of the indicated representative myeloid differentiation genes in leukemic Molm13 shCTRL or shHIF2α cells recovered from bone marrow. Values are represented as fold change in gene expression compared to shCTRL cells. Data represent mean ± SD of three biological replicates (Student's t‐test).
- qPCR of HIF2α in pre‐inoculated (Pre) Molm13 shCTRL or shHIF2α cells and in cells isolated from bone marrow at experimental endpoint (Post). Values indicate fold changes in gene expression compared to shCTRL cells. Data represent mean ± SD of three biological replicates (Student's t‐test).
Source data are available online for this figure.