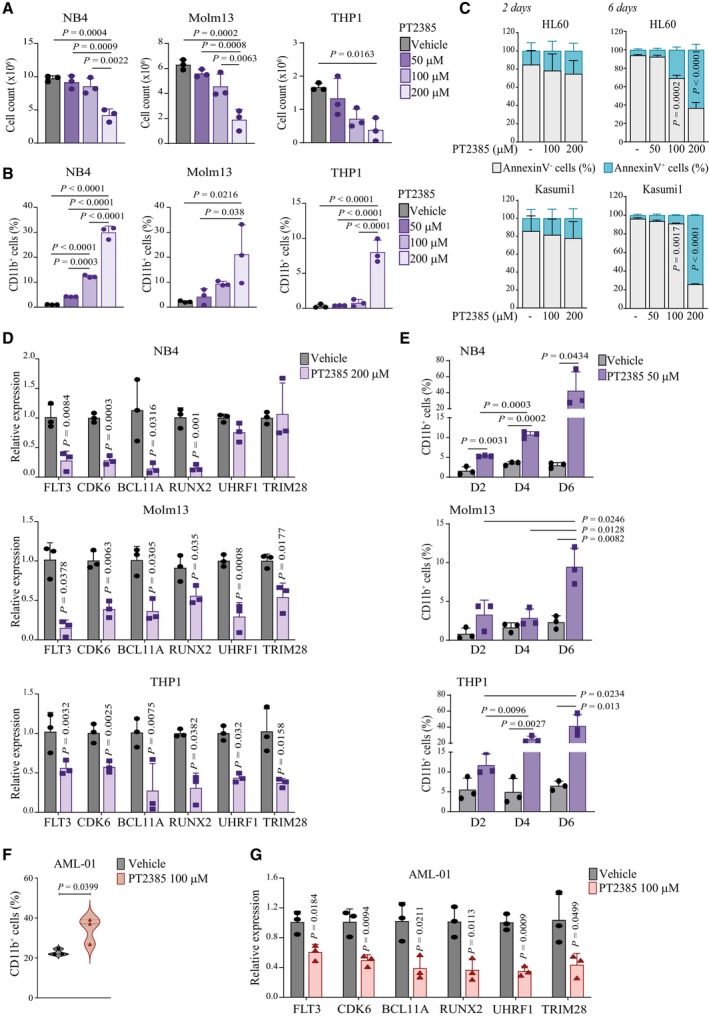
Cell numbers of NB4, Molm13 and THP1 cells 2 days after treatment with PT2385 at the indicated doses and compared to vehicle treated cells. Data represent mean ± SD of three biological replicates (one‐way ANOVA followed by Tukey's multiple comparison test).
Percentages of CD11b+ NB4, Molm13 and THP1 cells 2 days after treatment with PT2385 at the indicated doses and compared to vehicle treated cells. Data represent mean ± SD of three biological replicates (one‐way ANOVA followed by Tukey's multiple comparison test).
Relative proportion of live (AnnexinV−) and apoptotic (AnnexinV+) cells after treatment with PT2385 at the indicated doses for 2 and 6 days in HL60 (upper graphs) and Kasumi1 (lower graphs) cells. Data represent mean ± SD of three biological replicates (Student's t‐test).
qPCR analysis of the indicated genes in NB4 (upper graph), Molm13 (middle graph) and THP1 (lower graph) cells 2 days after treatment with 200 μM PT2385. Values are represented as fold change in gene expression compared to vehicle treated cells. Data represent mean ± SD of three biological replicates (Student's t‐test).
Percentages of CD11b+ NB4 (upper graph), Molm13 (middle graph) and THP1 (lower graph) cells at the indicated days (D2, D4, D6) after treatment with 50 μM PT2385 and compared to vehicle treated cells. Data represent mean ± SD of three biological replicates (Student's t‐test).
Percentages of CD11b+ AML‐01 cells isolated from the bone marrow of PDX mice and treated ex vivo with 100 μM PT2385 for 4 days. Data represent mean ± SD of three biological replicates (Student's t‐test).
qPCR analysis of the indicated genes in AML‐01 cells upon ex vivo treatment with 100 μM PT2385. Values are represented as fold changes in gene expression compared to control vehicle treated cells. Data represent mean ± SD of three biological replicates (Student's t‐test).

