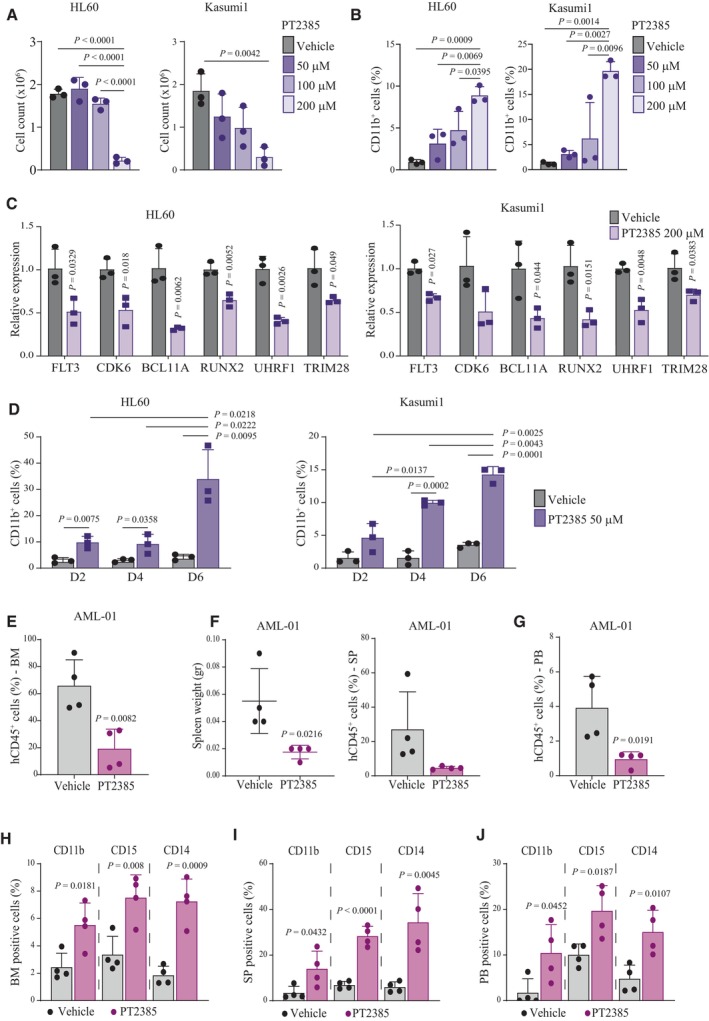
Figure 4. Specific inhibition of HIF2α by PT2385 promotes AML differentiation and impairs leukemia progression.

-
ACell numbers of HL60 and Kasumi1 cells 2 days after treatment with PT2385 at the indicated doses and compared to vehicle treated cells. Data represent mean ± SD of three biological replicates (one‐way ANOVA followed by Tukey's multiple comparison test).
-
BPercentages of CD11b+ HL60 and Kasumi1 cells 2 days after treatment with PT2385 at the indicated doses and compared to vehicle treated cells. Data represent mean ± SD of three biological replicates (one‐way ANOVA followed by Tukey's multiple comparison test).
-
CqPCR analysis of the indicated genes in HL60 and Kasumi1 cells 2 days after treatment with 200 μM PT2385. Values are represented as fold change in gene expression compared to vehicle treated cells. Data represent mean ± SD of three biological replicates (Student's t‐test).
-
DPercentages of CD11b+ HL60 and Kasumi1 cells at the indicated days (D2, D4, D6) after treatment with 50 μM PT2385 and compared to vehicle treated cells. Data represent mean ± SD of three biological replicates (Student's t‐test).
-
EPercentage of leukemic cells (hCD45+) in the bone marrow (BM) of mice injected with AML‐01 cells and treated with 100 mg/kg PT2385 or vehicle. Data represent mean ± SD of four biological replicates (Student's t‐test).
-
FSpleen weights (left graph) and percentages of leukemic cells (hCD45+, right graph) in the spleen (SP) of mice injected with AML‐01 cells and treated with 100 mg/kg PT2385 or vehicle. Data represent mean ± SD of four biological replicates (Student's t‐test).
-
GPercentages of leukemic cells (hCD45+) in the peripheral blood (PB) of mice injected with AML‐01 cells and treated with 100 mg/kg PT2385 or vehicle. Data represent mean ± SD of four biological replicates (Student's t‐test).
-
H–JPercentages of leukemic (hCD45+) cells expressing CD11b, CD15 and CD14 in the bone marrow (BM; H), spleen (SP; I) and peripheral blood (PB; J) of mice injected with AML‐01 cells and treated with 100 mg/kg PT2385 or vehicle. Data represent mean ± SD of four biological replicates (Student's t‐test).
Source data are available online for this figure.
