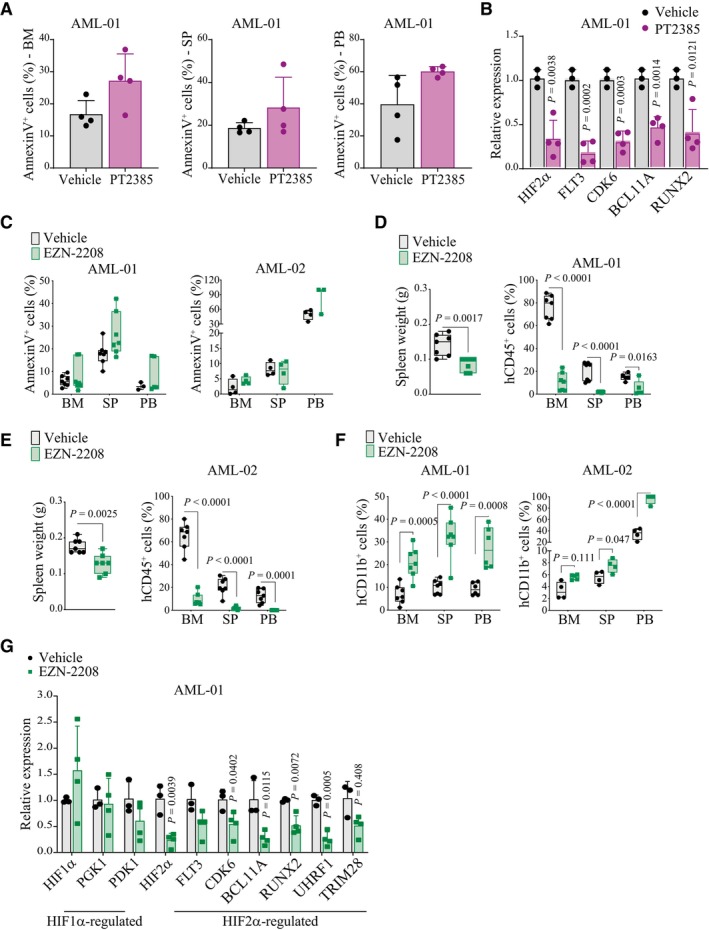
Percentages of leukemic cells (hCD45+) expressing AnnexinV in bone marrow (BM, left graph), spleen (SP, middle graph) and peripheral blood (PB, right graph) of mice transplanted with AML‐01 cells and treated with 100 mg/kg PT2385 or vehicle. Data represent mean ± SD of four biological replicates.
qPCR analysis of HIF2α and HIF2α‐regulated genes in AML‐01 cells isolated from the bone marrow of leukemic mice treated with 100 mg/kg PT2385 (n = 4) or vehicle (n = 3). Values indicate fold change in gene expression compared to control vehicle treated cells and represent mean ± SD of 3/4 biological replicates (Student's t‐test).
Percentages of apoptotic leukemic cells (AnnexinV+hCD45+) in bone marrow (BM), spleen (SP) and peripheral blood (PB) of mice transplanted with AML‐01 (left graph) or AML‐02 (right graph) and treated with EZN‐2208. Data are represented in box and whisker plots where the central band denotes the median value, box contains interquartile ranges, while whiskers mark minimum and maximum values. All biological replicates are shown (n = 7 in AML‐01, n = 4 in AML‐02).
Spleen weight (left graph) and percentages of leukemic cells (hCD45+, right graph) in BM, SP, and PB of mice transplanted with AML‐01 and treated with EZN‐2208 as in (C). Data are represented in box and whisker plots where the central band denotes the median value, box contains interquartile ranges, while whiskers mark minimum and maximum values. All biological replicates are shown (n = 7, Student's t‐test).
Spleen weight (left graph) and percentages of leukemic cells (hCD45+, right graph) in BM, SP, and PB of mice transplanted with AML‐02 and treated with EZN‐2208 as in (C). Data are represented in box and whisker plots where the central band denotes the median value, box contains interquartile ranges, while whiskers mark minimum and maximum values. All biological replicates are shown (n = 7, Student's t‐test).
Percentages of leukemic AML‐01 and AML‐02 cells expressing CD11b (hCD11b+hCD45+) in BM, SP, and PB of mice transplanted with AML‐01 (left graph) and AML‐02 (right graph) and treated with EZN‐2208. Data are represented in box and whisker plots where the central band denotes the median value, box contains interquartile ranges, while whiskers mark minimum and maximum values. All biological replicates are shown (n = 7 in AML‐01, n = 4 in AML‐02, Student's t‐test).
qPCR of the indicated genes in cells isolated from BM of vehicle (n = 3) and EZN‐2208 treated (n = 4) AML‐01 transplanted mice. Values indicate fold changes in gene expression of EZN‐2208 treated cells compared to vehicle treated control cells. Data represent mean ± SD of 3/4 biological replicates (Student's t‐test).

