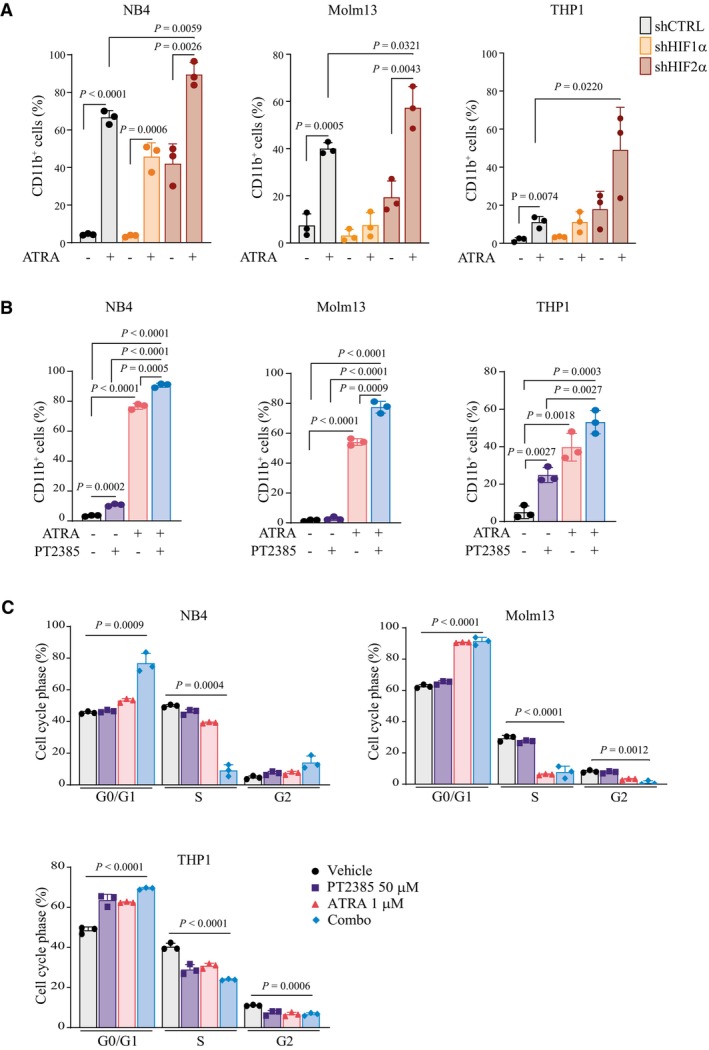
Figure EV5. Combination of HIF2α inhibition and ATRA increases AML differentiation in NB4, Molm13, and THP1 cells.

- Percentages of CD11b+ NB4 (left graph), Molm13 (middle graph) and THP1 (right graph) cells with shRNAs against HIF1α, HIF2α, or a scrambled shRNA as control (shCTRL) treated with 1 μM ATRA for 2 days. Data represent mean ± SD of three biological replicates (one‐way ANOVA followed by Tukey's multiple comparison test).
- Percentages of CD11b+ NB4 (left graph), Molm13 (middle graph) and THP1 (right graph) cells following treatment with 50 μM PT2385, 1 μM ATRA, or combination for 4 days. Data represent mean ± SD of three biological replicates (one‐way ANOVA followed by Tukey's multiple comparison test).
- Percentages of NB4 (left graph), Molm13 (right graph) and THP1 (lower graph) cells in the indicated phases of the cell cycle following treatment with 50 μM PT2385, 1 μM ATRA, or combination for 4 days. Data represent mean ± SD of three biological replicates (Student's t‐test).
