-
A
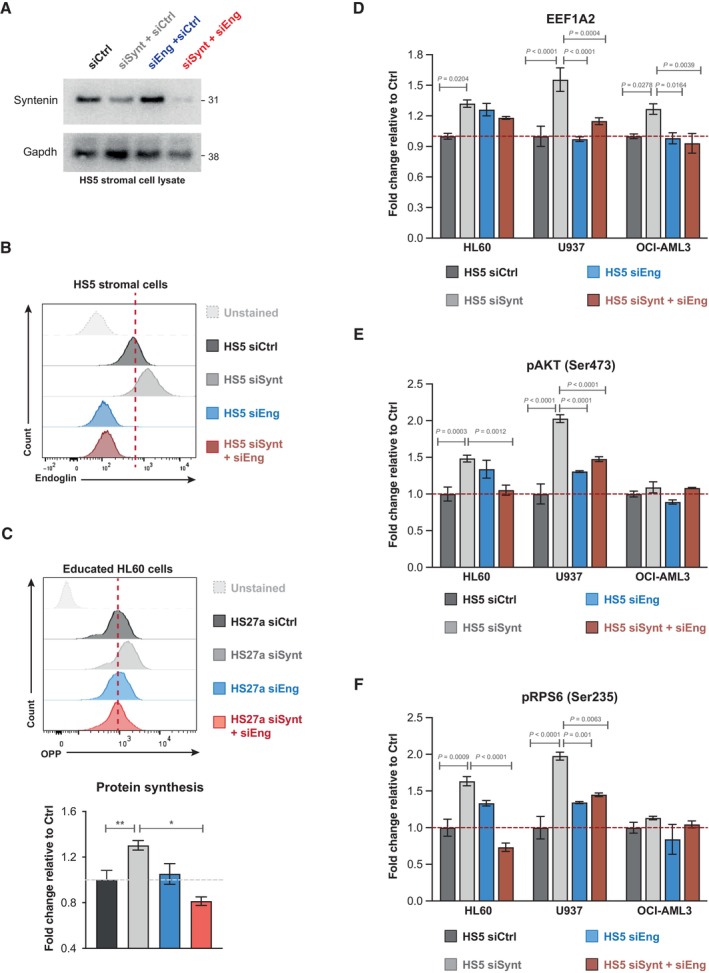
Western blots of the lysates of HS5 cells transfected with control siRNA (siCtrl), with control siRNA and siRNA‐targeting syntenin (siSynt + siCtrl) or endoglin (siEng + siCtrl), or siRNA‐targeting syntenin and endoglin (siSynt + siEng; 30 nM), showing the effects on syntenin levels. GAPDH was used as control.
-
B
FACS analysis of the endoglin expression at the surface of HS5 cells transfected with control siRNA (siCtrl, dark gray), with control siRNA and siRNA‐targeting syntenin (siSynt + siCtrl, light gray) or endoglin (siEng + siCtrl, blue), or siRNA‐targeting syntenin and endoglin (siSynt + siEng; red). Isotype control antibody was used as control (unstained).
-
C
HS27a (stroma) cells were transfected with siRNA‐targeting syntenin (siSynt), endoglin (siEng), both (siSynt + siEng), or control siRNA (siCtrl). After 24 h, HL60 (leukemia) cells were put in contact with the transfected HS27a cells. After 1 week of co‐culture, HL60 cells were collected and re‐seeded on freshly transfected HS27a cells. After 3 weeks of co‐culture, AML cells were collected and treated with O‐propargyl‐puromycin (OPP) to measure protein synthesis by FACS. Upper panel, FACS detection of OPP incorporation in HL60 cells educated on HS27a treated as indicated. Untreated refers to HL60 cells not treated with OPP. Lower panel, graph representing the relative levels of protein synthesis in HL60 cells, normalized to untreated HL60 cells ± SEM. Values were calculated from four independent experiments. Statistical analysis was performed using the one‐way analysis of variance (ANOVA).
-
D–F
HS5 cells were transfected with siRNA‐targeting syntenin (siSynt), endoglin (siEng), both (siSynt + siEng), or control siRNA (siCtrl). Twenty‐four hours later, human AML HL60, U937, or OCI‐AML3 cells were co‐cultured with these HS5 cells. After 1 week of co‐culture, AML cells were collected and re‐seeded on freshly transfected HS5 cells. After 3 weeks of co‐culture, AML cells were collected for FACS analysis of (D) EEF1A2, (E) pAKT (Ser473), and (F) pRPS6 (Ser235), respectively. The histograms represent the fold change in mean of fluorescence intensity relative to the signal in AML cells maintained on HS5 cells transfected with siCtrl ± SEM calculated from the analysis of three independent experiments. Statistical analysis was performed using the nonparametric two‐way analysis of variance (ANOVA).

