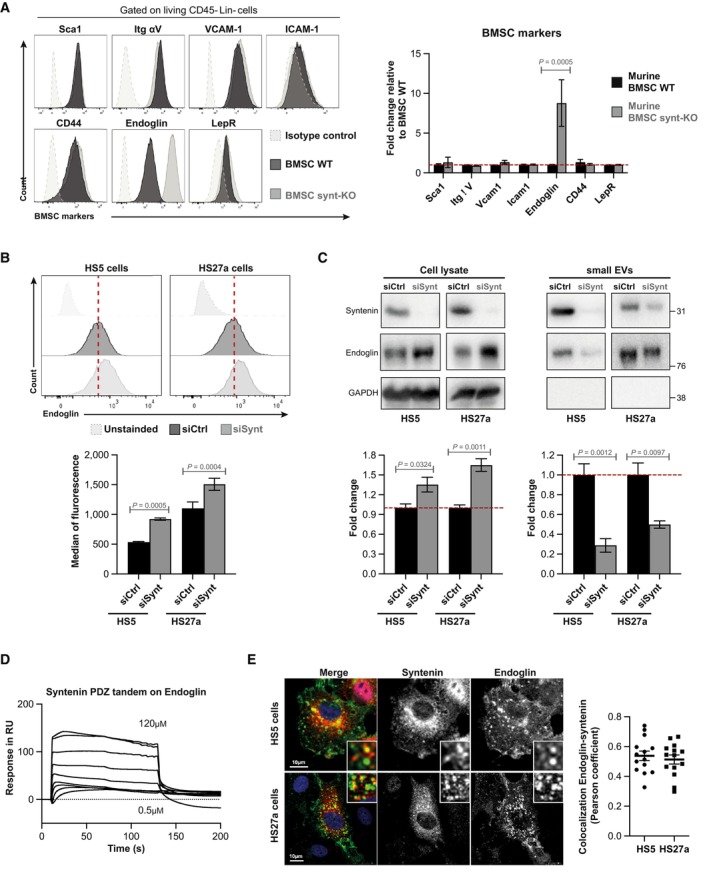
Figure 5. Syntenin deficiency in BMSC affects the subcellular expression of endoglin.

- Left, FACS analysis of cell surface BMSC markers (as indicated) in WT (black lane) or Synt‐KO (gray lane) murine expanded BMSC (passage 4). Right, histogram representing the fold change in the median of fluorescence relative to that measured in BMSC WT ± SEM, calculated from the analysis of five independent experiments. Statistical analysis was performed using parametric Student's t‐test.
- Upper, FACS detection of the cell surface expression of endoglin in HS5 and HS27a stromal cells transfected with siRNA‐targeting syntenin (siSynt; gray histogram) or control siRNA (siCtrl; black histogram). Lower, histogram representing the median of fluorescence of endoglin ± SEM. Values were calculated from three independent experiments. Statistical analysis was performed using the two‐way analysis of variance (ANOVA).
- HS5 and HS27a cells were transfected with siRNA‐targeting syntenin (siSynt) or control siRNA (siCtrl). After 48 h, the media were changed and the transfected cells were cultured in medium containing EV‐depleted FCS (10%) for 16 h. Conditioned medium was submitted to differential centrifugation and small EVs were pelleted at 100,000 g. Upper, total cell lysates and corresponding pelleted extracellular particles (small EVs) were analyzed for indicated markers. Lower, histograms represent the endoglin protein levels in HS5 and HS27a cell lysates (normalized to GAPDH) and in corresponding small EVs. Values were calculated from three independent experiments. Statistical analysis was performed using one‐way ANOVA test.
- Surface plasmon resonance experiment illustrating the direct syntenin–endoglin interaction, tested with recombinant polypeptides. Increasing concentrations of syntenin (comprising only the tandem‐PDZ domains + C‐terminal domain; 0.5 μM to 120 μM) were perfused on an immobilized peptide corresponding to the last 25 C‐terminal amino acids of wild‐type endoglin.
- Left, representative confocal micrographs showing the steady‐state distributions of endogenous syntenin and endogenous endoglin in HS5 and HS27a stromal cells. In merge, nuclei are stained with DAPI (blue), syntenin is in red, and endoglin is in green. Right, Pearson correlation coefficient in 16 HS5 and 14 HS27a cells using the JACoP plugin on ImageJ. Dot plots with bars representing the mean Pearson coefficient ± SEM from three independent experiments.
Source data are available online for this figure.
