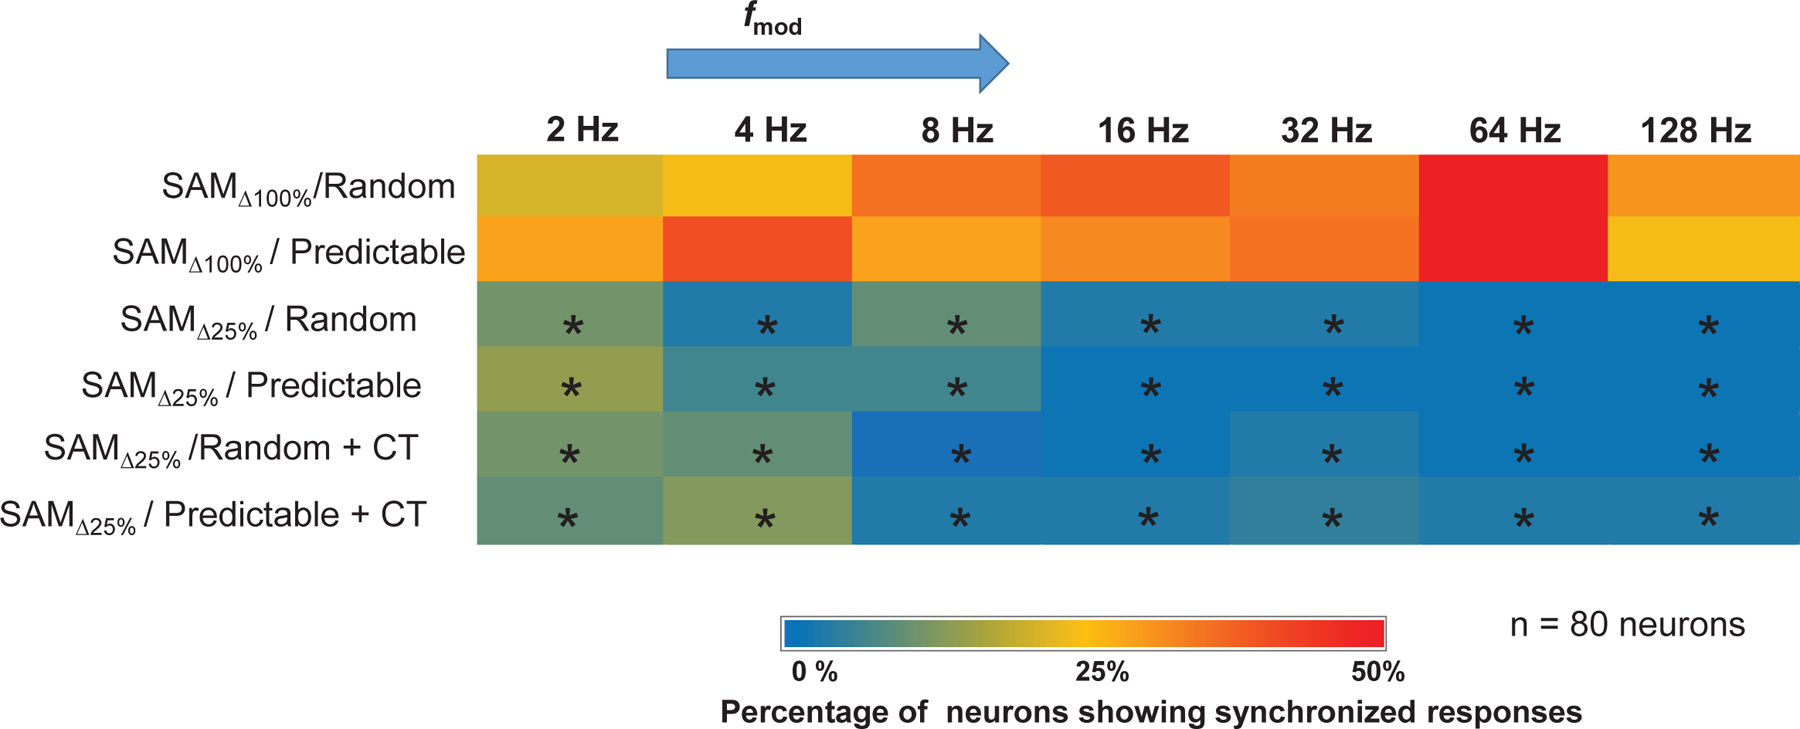
Figure 2: Effects of stimulus modulation depth on temporal locking properties of MGB units:

To assess the ability of units to temporally follow the SAM stimulus, the Rayleigh score for each (2–128) was used to generate a heat map based on the temporal responses of all 80 MGB units studied. MGB units might lock to a single or multi based on the Rayleigh score. Warmth of color indicates the percentage of neurons (out of 80) showing temporal-locking (Rayleigh statistic ≥ 13.8) to the SAM stimuli. Hot colors (red) indicate a higher percentage of units showing temporal-locking (e.g at 64 Hz ), whereas cool colors (blue) indicate a lower percentage of units showing temporal locking (e.g. at 16 Hz ). Significant differences were observed between and regardless of order of presentation, with and without CT blockade (Wilcoxon test followed by Bonferroni correction, p < 0.05).
