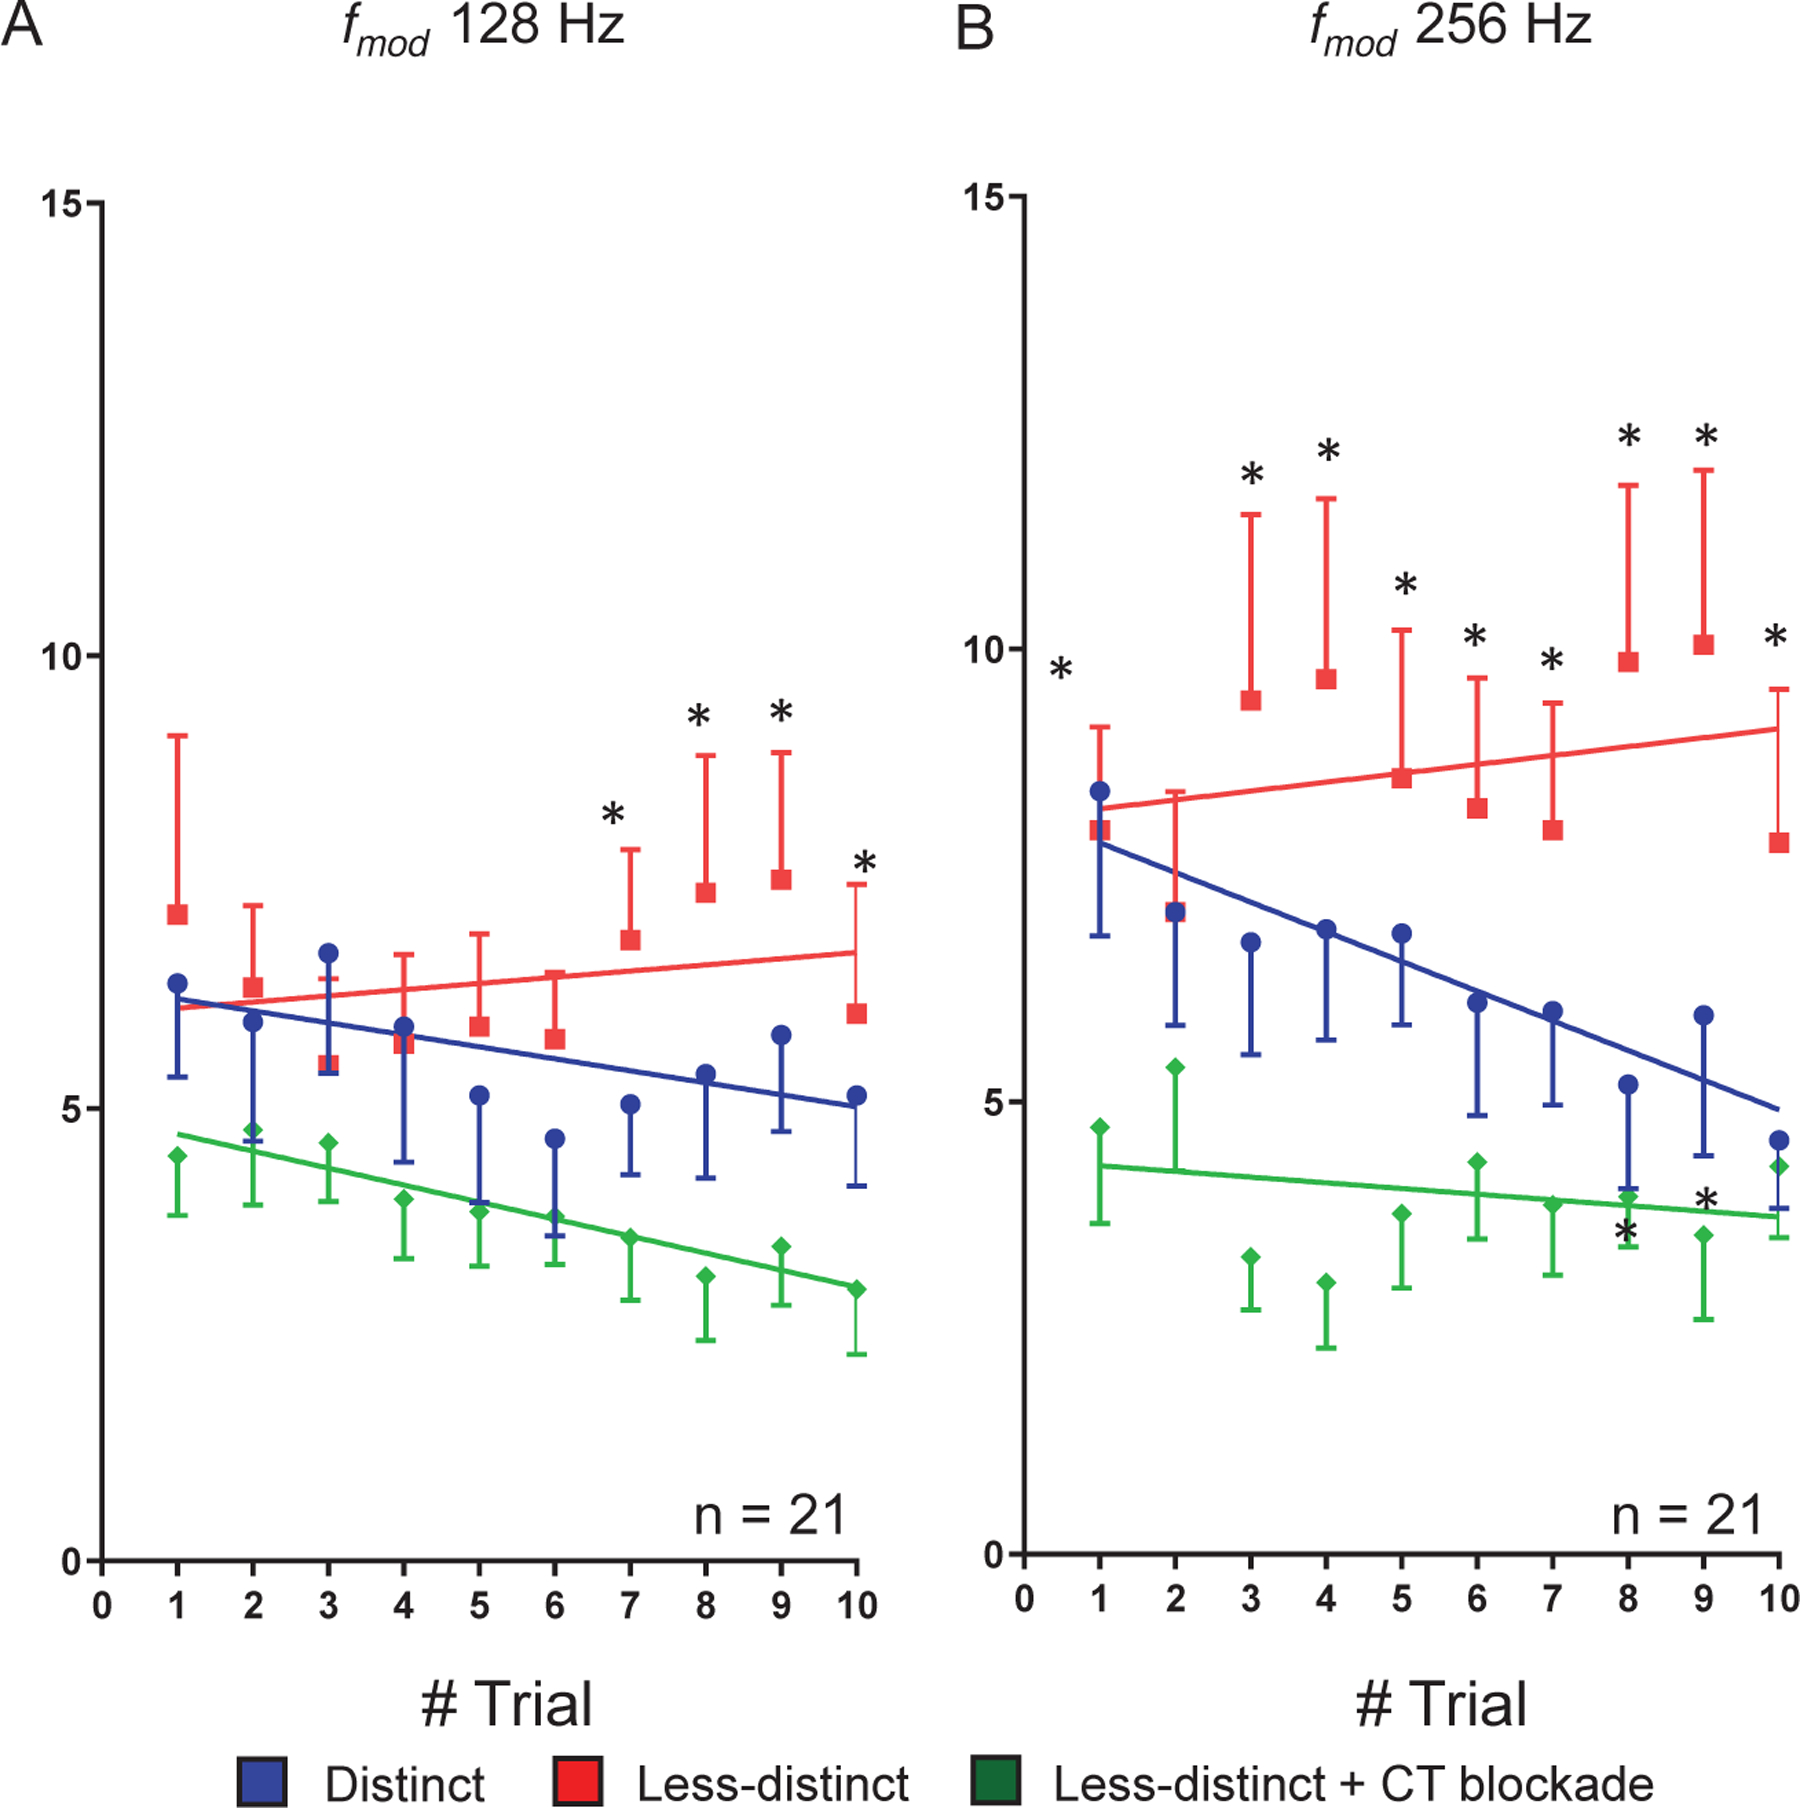
Figure 7:

Trial-by-trial response analysis to to with and without corticothalamic (CT) blockade. Single-units showing PPI changes larger than 0.3 at high when switch from to are included in the trail by trial analysis. Group (n = 21) trial-by-trial responses to predictable SAM at 128Hz (A) and 256Hz (B). These units show adapting responses to 10 presentations of repeating salient stimuli (blue dot). Decreasing SAM modulation depth switched the trial-by-trial responses from adapting to predictable with spikes increasing with each successive presentation of the stimulus (red dot). Optical CT blockade reversed the predictive response (green dot). Trend line slopes were significantly different for the three conditions for average spikes to predictable presentation of at 128 Hz (A, ANCOVA, two-tailed, p < 0.05). Differences were significant at individual trial 7, 8, 9 and 10 in between and stimulus conditions (p < 0.05, Friedman test followed Wilcoxon test) (A). Similarly, Trend line slopes were significantly different for the three conditions for average spikes to predictable presentation at 256 Hz (B) (ANCOVA, two-tailed, p < 0.05). Differences were significantly different at trial 1, 3, 4, 5, 6, 7, 8, 9, and 10 between vs. with CT blockade. There were significant differences between and stimuli at trial 8 and 9 in their firing rates (B) (p < 0.05, Friedman test followed Wilcoxon test).
