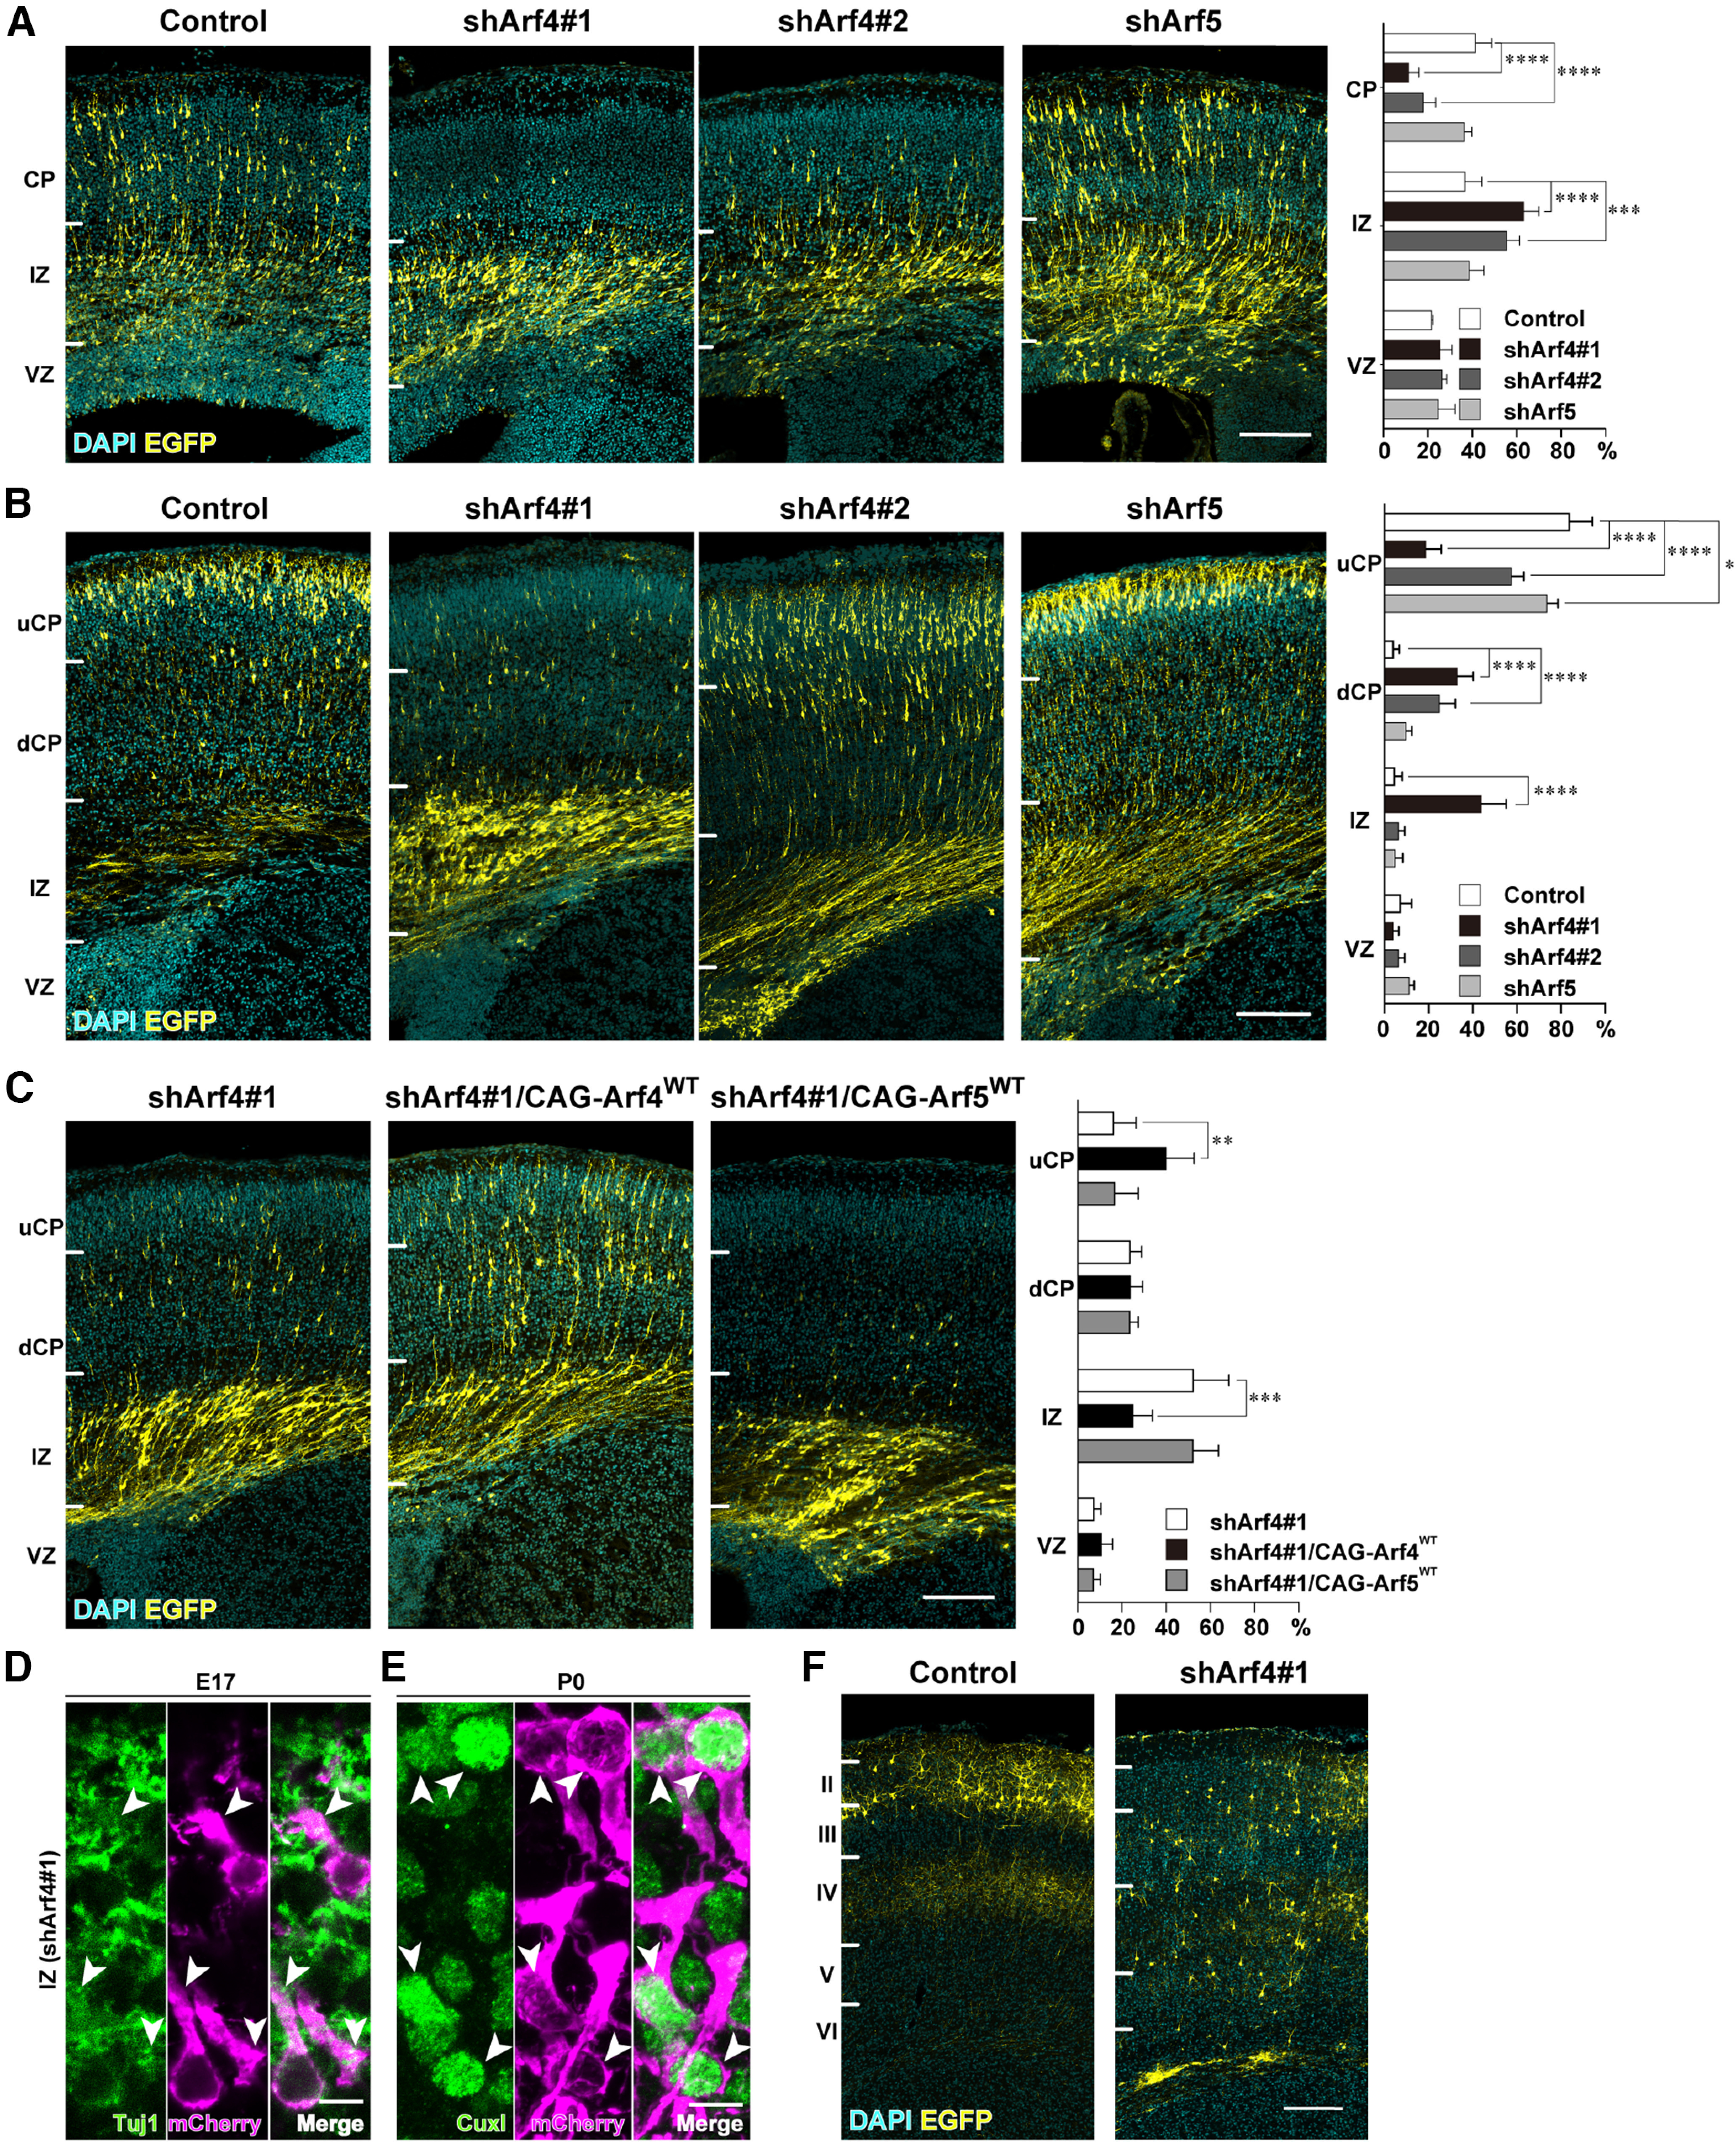
Figure 4.

Knock-down of Arf4 disturbs cortical radial migration. A, Representative micrographs of E17 cerebral cortices electroporated with the mU6pro plasmids for control shRNA, shArf4#1, shArf4#2, or shArf5, and pCAGGS-EGFP at E14 (Control, n = 4 embryos; shArf4#1, n = 5 embryos; shArf4#2, n = 5 embryos; shArf5, n = 4 embryos). The cortical wall was divided into three zones, i.e., cortical plate (CP), intermediate zone (IZ), and ventricular zone (VZ), by nuclear density. B, Representative micrographs of P0 cerebral cortices electroporated with control, shArf4#1, shArf4#2, or shArf5 plasmids and pCAGGS-EGFP at E14 (Control, n = 5 embryos; shArf4#1, n = 4 embryos; shArf4#2, n = 4; shArf5, n = 5 embryos). Cortical wall was divided into four zones, i.e., upper cortical plate (uCP), deep cortical plate (dCP), IZ, and VZ by the combination of the immunoreactivity for Cux1 and nuclear density. C, Representative micrographs of P0 cerebral cortices electroporated with shArf4#1 (n = 4 embryos), shArf4#1 and pCAGGS-shRNA-resistant wild-type Arf4 (CAG-Arf4WT; n = 4 embryos), or shArf4#1 and pCAGGS-wild-type Arf5 (CAG-Arf5WT; n = 4 embryos) plus pCAGGS-EGFP at E14. Note that migration defects caused by Arf4 knock-down could be partially rescued by coexpression of Arf4, but not Arf5. D, E, Representative immunofluorescence images showing the effect of Arf4 knock-down on the expression of Tuj1 (D) and Cux1 (E). Sections of the E17 (D) or P0 (E) cerebral cortices that had been electroporated with shArf4#1 and mCherry at E14 were subjected to double immunofluorescence with antibodies against Tuj1 (D) or Cux1 (E) and mCherry. Arrowheads indicate the expression of Tuj1 or Cux1 in shArf4#1-transfected cells visualized by mCherry immunofluorescence in the IZ. F, Representative micrographs of P10 cerebral cortices electroporated with the control shRNA or shArf4#1 at E14. Note that control plasmid-transfected neurons were located in the Layer II or III, whereas shArf4#1-transfected neurons were scattered throughout the CP. Graphs in A–C show the quantification of the distribution of EGFP-positive cells in cortical zones. Data were presented as mean ± SD and statistically analyzed using two-way ANOVA followed by Tukey–Kramer’s test (*p < 0.05, **p < 0.05, ***p < 0.005, ****p < 0.0001). Scale bars: 200 μm in A–C, and F, 10 μm in D and E.
