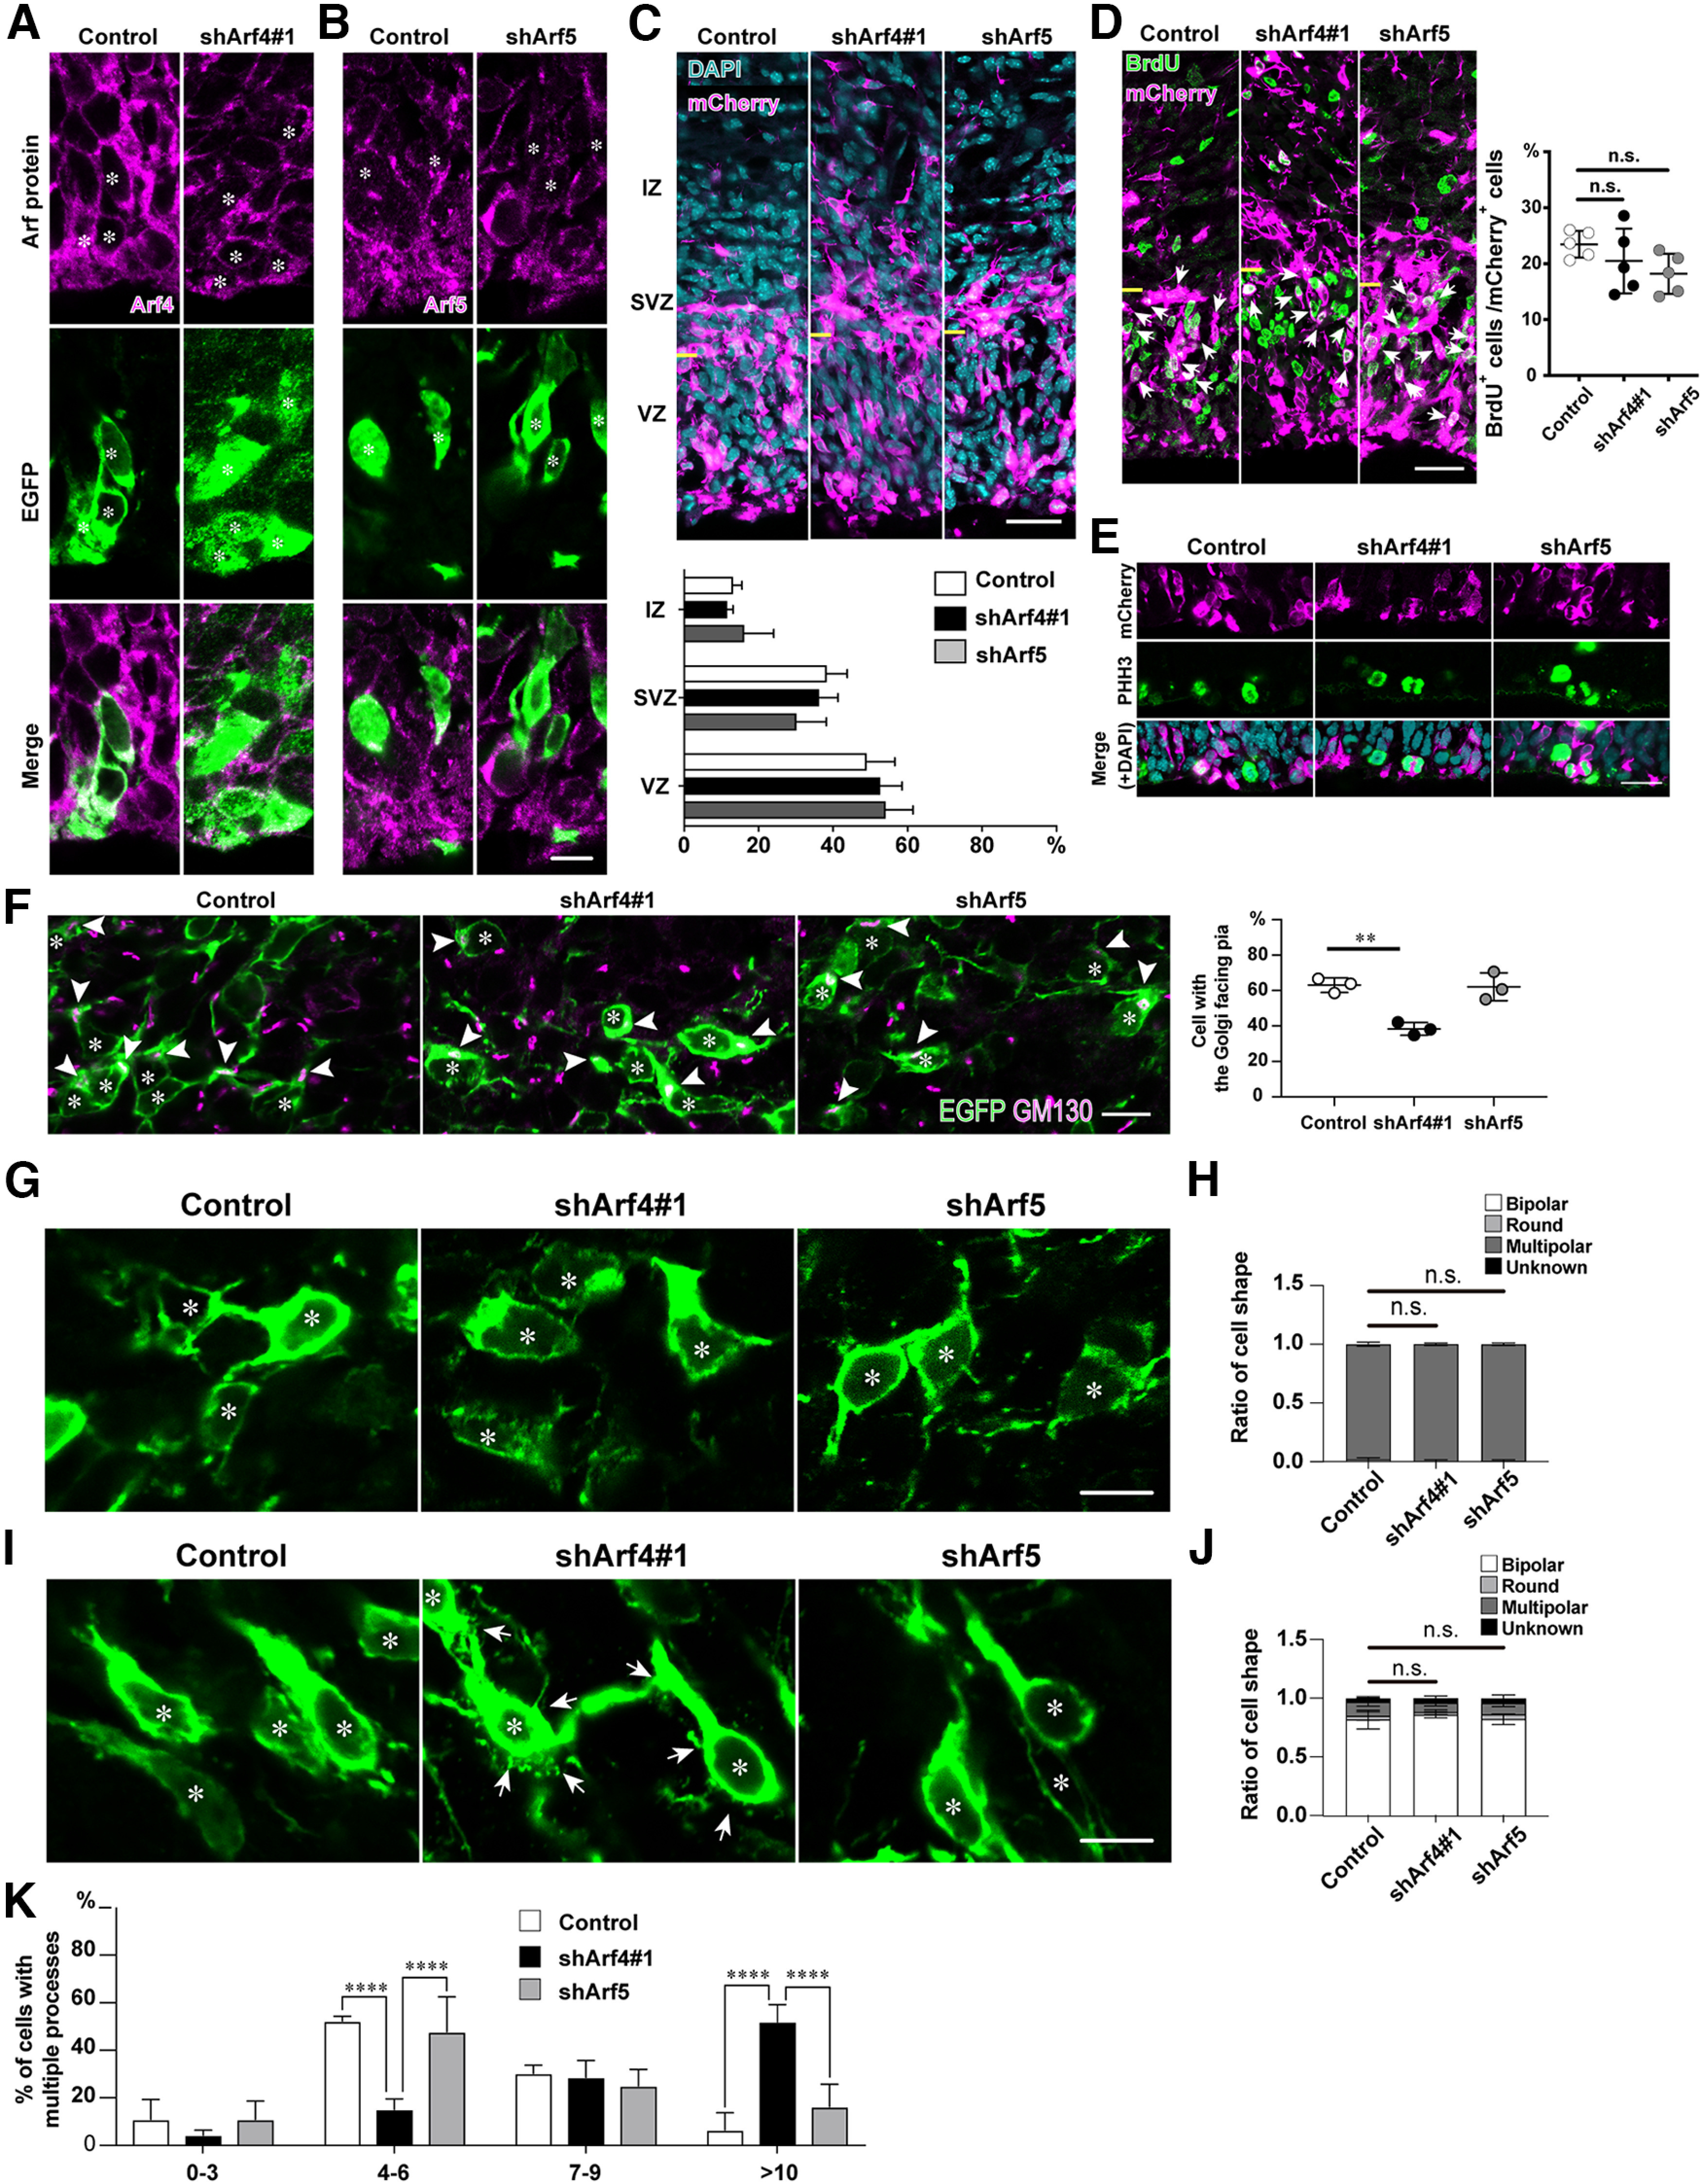
Figure 5.

Knock-down of Arf4 disturbs the Golgi orientation, but not multipolar-to-bipolar morphologic transition in the IZ. A, B, Representative immunofluorescence images of the ventricular zone at E15 at 1 d after electroporation with indicated shRNA and EGFP. Note that ventricular cells transfected with shArf4#1 (A) or shArf5 (B) exhibited reduced endogenous expression of the respective Arf. Asterisks in A and B indicate the nuclei of transfected cells. C, Representative micrographs of E15 cerebral cortices electroporated with control, shArf4, or shArf5 plasmids plus pCAGGS-mCherry. The VZ, SVZ, and IZ were divided by the immunoreactivity for Sox2 and nuclear density. Yellow bars indicate border between the VZ and SVZ. The graph shows the percentage of transfected cells in each zone. D, Representative micrographs showing the effect of knock-down of Arf4 or Arf5 on BrdU incorporation in the VZ at E15. Embryos were electroporated with indicated shRNA plasmids plus pCAGGS-mCherry at E14, killed at E15 after BrdU administration, and immunostained with antibodies against mCherry (magenta) and BrdU (green). Arrows indicate the BrdU incorporation in transfected cells. Yellow bars indicate border between the VZ and SVZ. The graph shows the percentage of BrdU-incorporated cells in total transfected cells. E, Representative micrographs showing the effect of knock-down of Arf4 or Arf5 on phospho-histone H3 (PHH3)-positive cells in the VZ at E15. Note no differences in the proportion of PHH3-positive mitotic cells among the control, shArf4#1-transfected, or shArf5-transfected cells in the VZ. F, The orientation of the Golgi apparatus in migrating neurons in the lower IZ. Embryos were electroporated with indicated plasmids and pCAGGS-EGFP at E14, killed at E16, and immunostained with antibodies against GM130 (magenta) and EGFP (green). Arrowheads and asterisks indicate the Golgi apparatus and nuclei, respectively, in transfected cells. The graph shows the percentage of cells with the Golgi facing the CP in total EGFP-positive transfected cells in the IZ. G, I, High magnification of EGFP-positive multipolar migrating neurons in the lower IZ at E16 (G) and upper IZ at E17 (I). Asterisks in G and I indicate the nuclei of transfected cells. Arrows in I indicate filopodia-like fine processes extending from the cell body and leading process of shArf4#1-transfected cells. H, J, Graphs show that the proportion of the cell morphology of EGFP-positive cells in the lower IZ at E16 (H) and in the upper IZ (J). Note no significant effect of either Arf4 or Arf5 knock-down on multipolar-to-bipolar morphologic transition. K, Graph showing the proportion of the number of processes extending from the cell bodies in bipolar cells in the upper IZ at E17 transfected with control, shArf4#1, or shArf5. Data were presented as mean ± SD and statistically analyzed using one-way (D, F) or two-way (C, H, J, K) ANOVA followed by Tukey–Kramer’s test (**p < 0.005, ****p < 0.0001, n.s., not significant). Scale bars: 30 μm in C and D, 20 μm in E, and 10 μm in B, F, G, and I.
