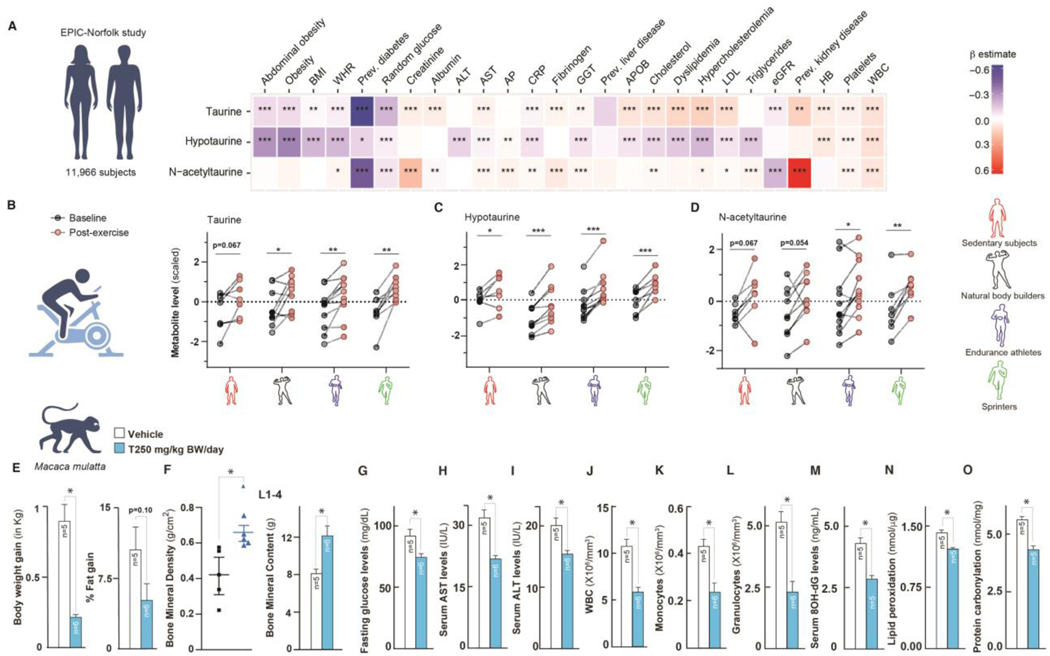
Fig. 4. Taurine pathway affects healthspan in primates.
(A) Heatmap showing the results from linear regression models for assessing the associations between clinical risk factors and taurine-related metabolites (taurine, hypotaurine, and N-acetyltaurine) in blood from 11,966 subjects in the EPIC-Norfolk study. Effect size and direction of these associations are given by the β-estimates resulting from these regression models. A negative β-estimate (blue color) indicates an inverse association, where higher levels of a metabolite correlated with lower levels of a clinical parameter. A positive β-estimate (red color) indicates a positive association, where higher levels of a metabolite correlated with higher levels of a clinical parameter. For example, as shown in blue, higher levels of taurine correlated with lower prevalence of type 2 diabetes. Taurine-related metabolites were measured using an untargeted metabolomics approach (Metabolon HD4 platform). Data were extracted from the open-access web server (https://omicscience.org/apps/mwasdisease/). BMI, Body mass index; WHR, waist-to-hip ratio; AST, aspartate aminotransferase; ALT, alanine aminotransferase; AP, alkaline phosphatase; CRP, C-reactive protein, APOB, apolipoprotein B; LDL, low-density lipoprotein; eGFR, estimated glomerular filtration rate; HB, hemoglobin; WBC, white blood cell count. (B-D) Serum taurine (B), hypotaurine (C), and N-acetyltaurine (D) levels at fasted rest (=baseline) and 5 minutes after a maximum graded exercise test (= post-exercise) in three groups of competitive athletes and healthy sedentary subjects. Metabolite levels are provided as z-scores, i.e., relative to the mean of measured levels with mean = 0 and standard deviation = 1. (E-O) Body weight gain in kilogram and % fat gain (E), bone mineral density and content in Lumber 1–4 (F, bone), fasting glucose levels (G, pancreas function), serum AST and ALT levels (H-I, liver dysfunction markers), WBC/monocyte/granulocyte numbers (J-L, immunophenotyping in blood), serum 8-OH-dG, lipid peroxide, and protein carbonyl levels (M-O, indirect markers of ROS-induced molecular damages) in 15-year-old monkeys orally fed once-daily with vehicle (T0) or taurine (T250) for 6 months. Statistical analysis: (A) Summary statistics, including standardized regression coefficients (β-estimates) and nominal p-values on a relevant subset of 26 clinical traits and three taurine-related metabolites were extracted from the web server. Regression coefficients and nominal p-values were plotted in a heatmap using R version 4.1.0. Statistical analysis for the exercise cohort (B-D): Differences between baseline and post-exercise metabolite levels were analyzed per subject group using a paired sample t-test. Batch corrections were done using R version 4.1.0; the graphs were prepared using GraphPad Prism. For other panels (E-O), statistical analysis was performed using Graph Pad Prism 7 employing the Student’s t-test, one-way or two-way ANOVA. All values are mean ± SEM. ns, not significant. p ≤ 0.0001****, p ≤ 0.001***, p ≤ 0.01**, and p ≤ 0.05* are versus WT or control.

