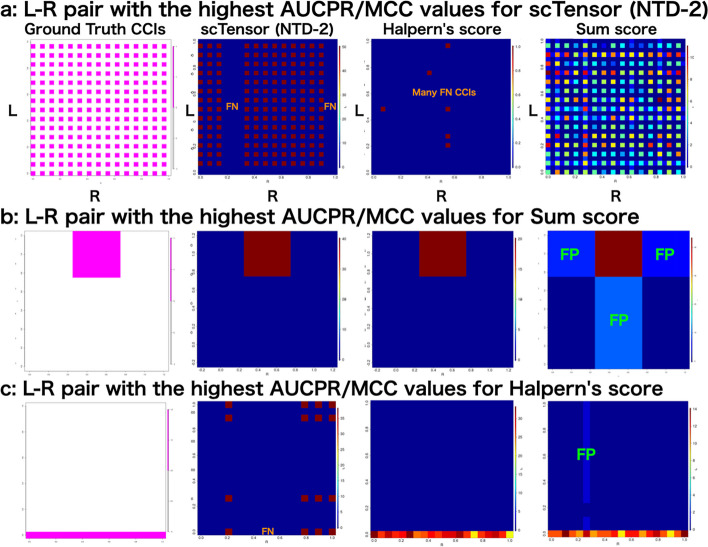
Fig. 4.
Analyses of three datasets in which each of the three methods excelled. Summary of the number of significant cell–cell interactions (CCIs) with a three cell types, one CCI types, one-to-one CCI style, and 1st-CCI type; b 20 cell types, five CCI types, many-to-many CCI style, 2nd-CCI type; and c 30 cell types, five CCI types, many-to-many CCI style, 5th-CCI type. The y-axis (L) and x-axis (R) indicate the ligand-expressing cell types and the receptor-expressing cell types, respectively. FN and FP indicate false negative and false positive CCIs, respectively

