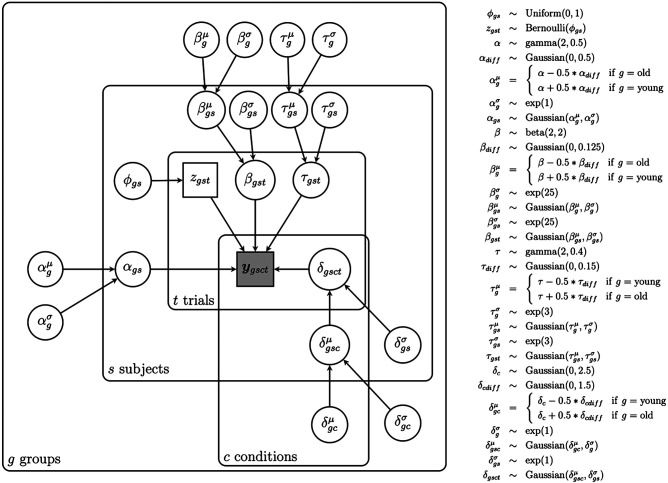
Figure 3.
A graphical representation of our hierarchical Bayesian diffusion model (full model) to investigate the difference in model parameters between older and younger adults in the MDT. The shaded node indicates the observed (bivariate) data (response type [correct/incorrect] and response time). Unshaded nodes indicate parameters that are being estimated in the model. The parameters β and τ are indexed for group (g), participant (s), and trial (t), meaning that we allowed those parameters to be different for each group, participant, and trial. The parameter δ is additionally indexed for condition (c), meaning that δ was also allowed to differ across conditions. The parameter α was allowed to differ across the two groups and participants.

