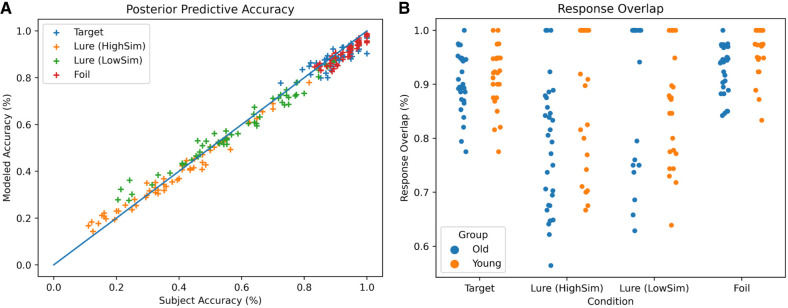
Figure 5.
Quality check of our model performance. (A) The modeled and observed accuracy for the full model. The modeled accuracy data fit the observed accuracy data well. Each cross (+) represents the accuracy of one participant averaged across all trials within each condition. (B) Overlap between the modeled and observed response type (“old”/“new”). Individual data points represent the percentage of agreement in response type between the observed and modeled data set for each participant and condition.

