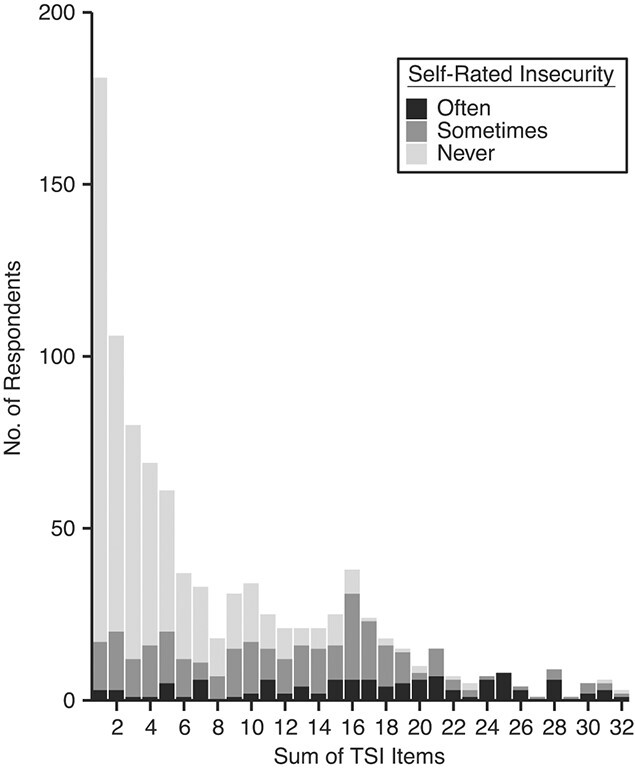
Figure 1.

Self-rated level of transportation insecurity by Transportation Security Index (TSI) sum score, United States, 2018. The figure shows the unweighted distribution of respondents with self-reported transportation insecurity by respondent’s TSI sum score for persons with scores greater than 1 (n = 939) in the 2018 GfK KnowledgePanel (GfK SE, Nuremberg, Germany).
