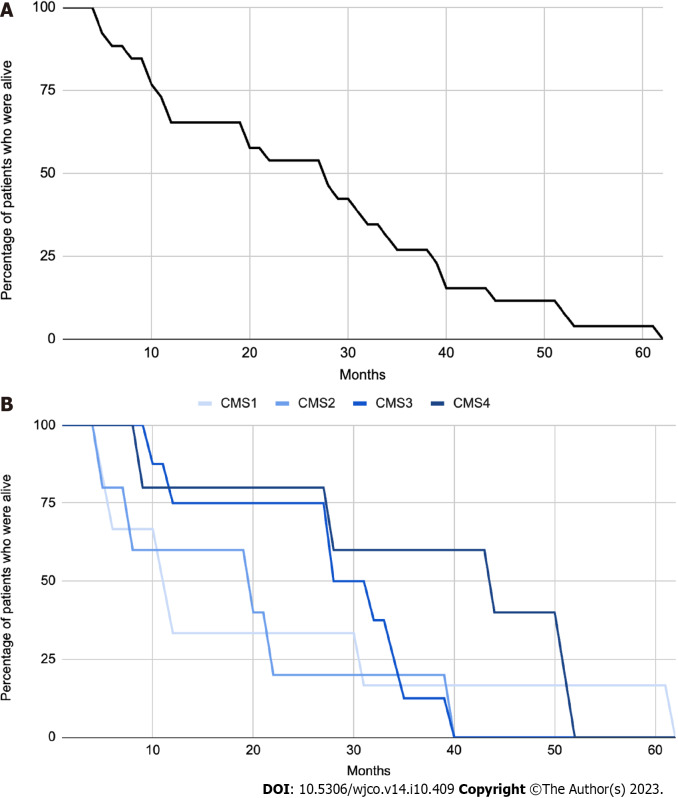
Figure 2.
Classification of patients into consensus molecular subtype categories. A: Kaplan-Meier Curve with overall survival (OS) of the n = 26 patients included on the final analysis. mOS = 28 mo; B: Kaplan-Meier curve which shows OS of patients based on their molecular subtype classification. The median overall survival times were 11, 20, 30, and 45 mo for CMS1, CMS2, CMS3, and CMS4, respectively. There were no statistically significant differences observed among the studied groups (P = 0.0968).

