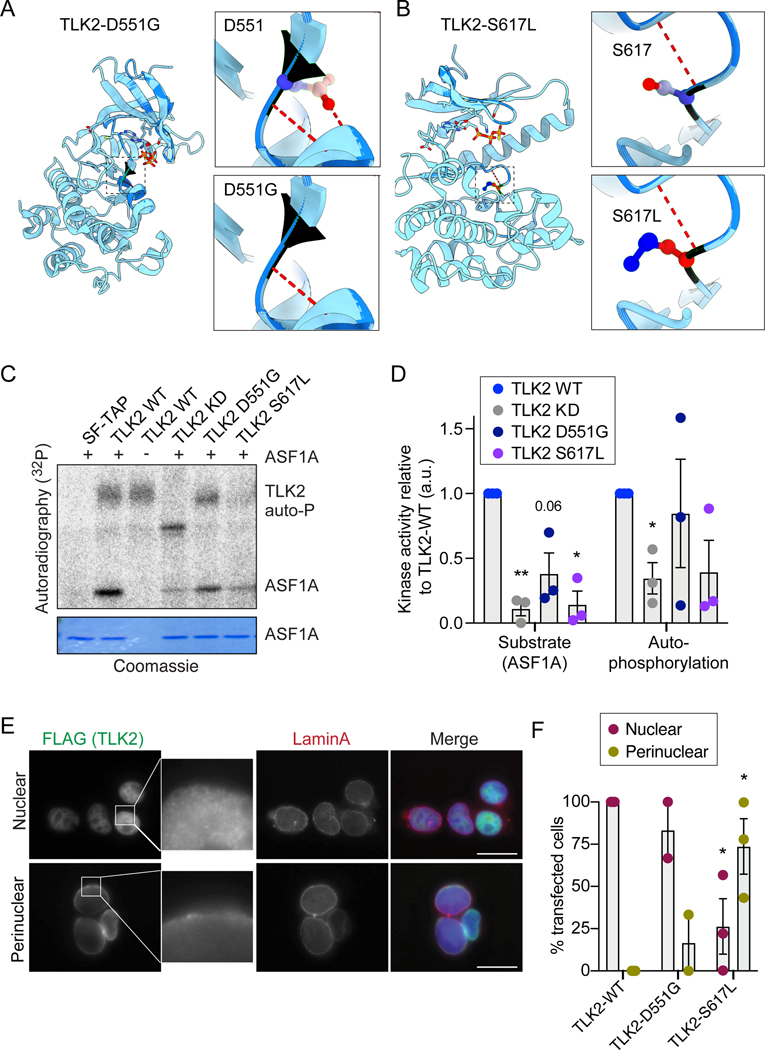
Figure 3. TLK2 autism mutations alter the activity and subcellular localization of TLK2.
(A-B) Modelling of the D551G and S617L missense mutations on the crystal structure of the TLK2 PKD. Hydrogen bonds are shown in red dashed lines. (C) Representative in vitro kinase assays with Strep-purified TLK2-WT, TLK2-KD (kinase dead; D592V) and indicated missense variants. Autophosphorylation and substrate (ASF1A) phosphorylation is shown. Coomassie is shown as loading control for ASF1A. (D) Quantification of n=3 independent kinase assays. Individual results (circles) are shown for each assay on purified ASF1A substrate or affinity purified TLK2 autophosphorylation relative to corresponding TLK2-WT and bars depict mean with SEM. (E) Representative immunofluorescence microscopy of overexpressed TLK2 in AD-293 cells is shown, indicating the 2 main localization patterns observed. The nuclear localization image corresponds to TLK2-WT, while the perinuclear localization to TLK2-S617L. Scale bar = 20 μM. (F) Quantification of TLK2 localization patterns for WT and indicated missense variants. Ten random fields were scored in 2 (D551G) or 3 (WT and S617L) biological replicates. Bars depict mean with SEM. Statistical significance was determined using an unpaired t test with Welch’s correction (****P<0.0001, ***P<0.001, **P<0.01, *P<0.05).

