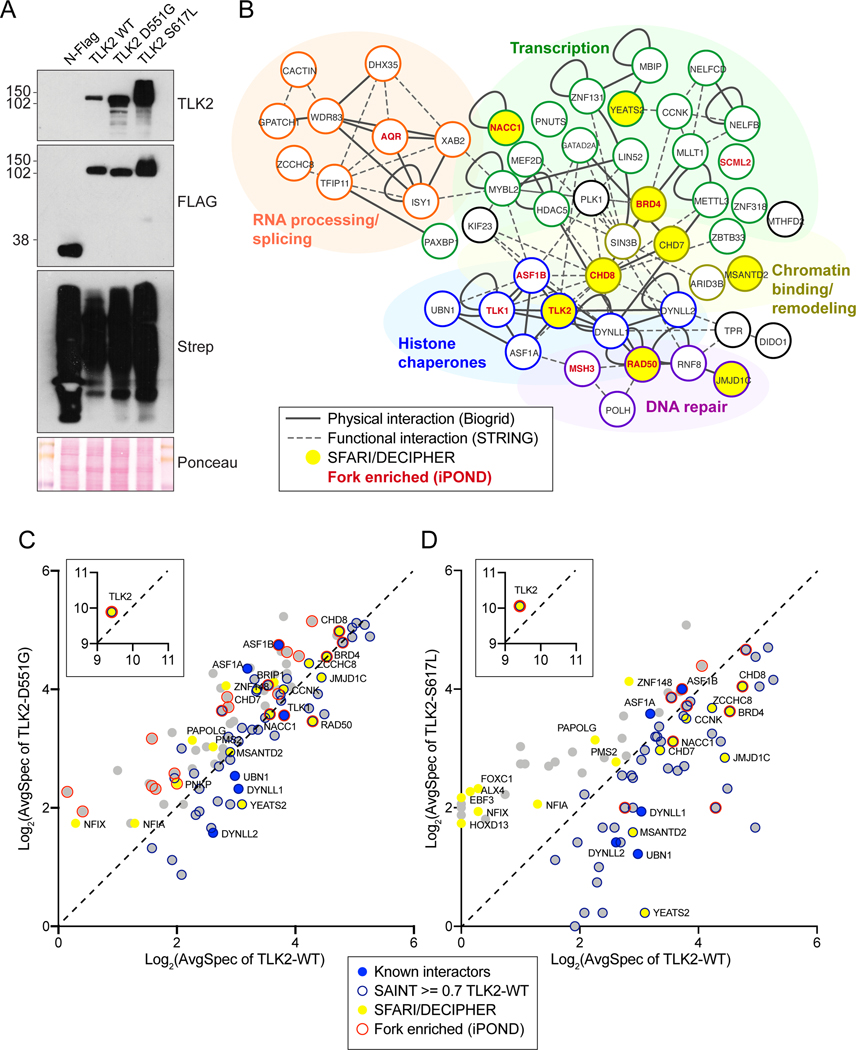
Figure 4. BioID based analysis of the proximal interactome of TLK2.
(A) Western blot of AD-293 lysates expressing BioID constructs: N-FLAG-BirA alone or fused to the indicated TLK2 allele. Detection with anti-TLK2, anti-FLAG or Streptavidin-HRP are shown. Ponceau stained nitrocellulose membrane is shown as a loading control. (B) Network clustering of all prey hits with a SAINT score of > or = to 0.7 in TLK2-WT samples. Physical interactions reported in Biogrid (solid lines) and functional interactions (dashed lines) reported in STRING are indicated[43, 44]. Functionally enriched clusters are indicated by color coding, Bait, TLK2 substrates, proteins found in the SFARI/DECIPHER gene database (yellow fill) or proteins enriched on nascent DNA/replication forks are indicated (red font). (C-D) Scatterplots of average spectral counts (Log2 transformed) of bait and prey proteins identified with the TLK2-D551G and TLK2-S617L alleles compared to TLK2-WT. Previously identified TLK2 interactors, as well as proteins enriched on replication forks or found in the SFARI/DECIPHER databases are indicated (see legend).

