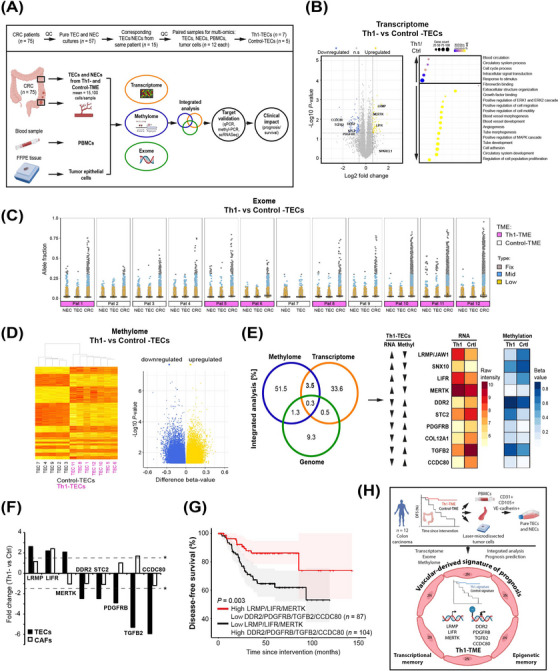
FIGURE 1.

Tumor microenvironment‐dependent epigenetic imprinting in the vasculature predicts colon cancer outcome. (A) Pure and viable tumor endothelial cells (TECs) and corresponding normal endothelial cells (NECs) were isolated from human CRC patients (mean 15,100 cells/sample) with different TMEs (Th1‐ vs Control‐TME). To exploit tumor vessel‐derived TME‐dependent transcriptional imprinting and mechanisms of its manifestation, the cells were expanded in culture and compared by a multi‐omics analysis of the transcriptome, methylome and exome. DNA extracted from fresh PBMCs and laser‐microdissected tumor cells from FFPE‐blocks of the same patients was used as a control in the exome analysis. The obtained results were subjected to integrated bioinformatical analyses and independently experimentally validated. The prognostic value of the extracted signature was analyzed in CRC patients. (B) Transcriptome analyses of Th1‐ vs Control‐TECs to identify DEGs (left, P < 0.05, log2FC > 0.585/FC > 1.5‐fold) and functional differences (right). n.s. = not significant. (C) Exome analysis of Th1‐ vs Control‐TECs as depicted by scatter plots of the PBMC‐corrected allele fractions with somatic variants in corresponding TECs, NECs, and tumor cells (CRC) for each patient depicted individually. Detailed subgroup analyses are shown in Supplementary Figure S6B. (D) Methylome analysis of Th1‐ vs Control‐TECs conducted by EPIC methylation chip analyses and depicted after hierarchical clustering (left, y‐axis corresponds to individual probe sets) and by a volcano plot (right, P < 0.05). (E) Integrated analysis (gene overlap percentage) of the transcriptome, methylome and genome reveals an increased methylome/transcriptome overlap as compared to the genome/transcriptome (left). The top 10 DEGs in Th1‐TECs and Control‐TECs with inverse relation of transcription and methylation are given (right). (F) TEC imprinting genes show a different expression pattern in cancer associated fibroblasts (CAFs) isolated from a Th1‐ vs. Control‐TME (n = 3 each) compared to TECs (FC > 1.5, *P < 0.05 is indicated by dashed lines). (G) Survival analysis as depicted by a Kaplan‐Meier curve of the 7 independently validated vascular imprinting genes associated with a Th1‐TME (high LRMP, LIFR and MERTK expression in combination with low DDR2, PDGFRB, TGFB2 and CCDC80 expression) predicted significantly improved disease‐free survival in CRC patients (GEO database GSE161158). (H) In summary, ultrapure viable TECs from 12 human CRC patients were isolated by FACS (CD31‐, CD105‐, and VE‐cadherin‐positive cells) and systematically compared at the genomic, transcriptional and epigenomic levels with corresponding normal endothelial cells (NECs), PBMCs and laser‐microdissected tumor cells. These analyses identified TME‐imprinted transcriptional imprinting in TECs maintained in culture by epigenetic mechanisms rather than somatic variants. Integrative bioinformatics retrieved a seven gene imprinting signature capable to predict patient's prognosis. Illustrations created using BioRender.com.
