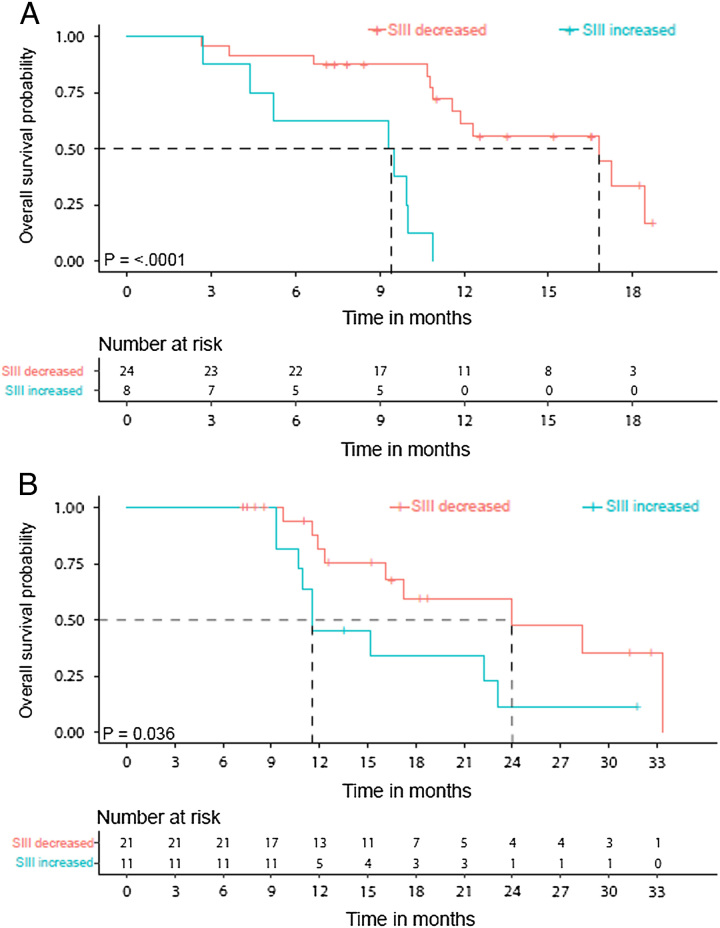
FIGURE 3.
Increased SIII after treatment was associated with worse OS. A, Kaplan-Meier curves comparing OS of patients with increased SIII value after FOLFIRINOX compared with the baseline value (n = 8) versus OS of patients with decreased SIII value after FOLFIRINOX compared with baseline (n = 24). B, Kaplan-Meier curves comparing OS of patients with increased SIII value after FOLFIRINOX and SBRT compared with the baseline value (n = 11) versus OS of patients with decreased SIII value after FOLFIRINOX and SBRT compared with baseline (n = 21). The curves are statistically compared with a log-rank test.

