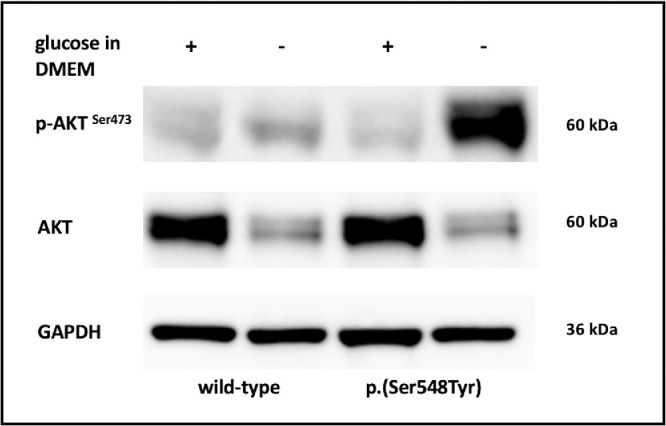
Figure 3.

Representative images showing immunoblot analysis of AKT, p-AKTSer473, and GAPDH in wild type cells and cells expressing the p.(Ser548Tyr) substitution cultivated with and without glucose. The p-AKTSer473/GAPDH ratio in p.(Ser548Tyr) cells after glucose withdrawal compared with wild-type cells after glucose withdrawal, and with p.(Ser548Tyr) cells under normal glucose conditions was 5.8 folds and 14 folds higher, respectively. All results were replicated in at least three independent experiments. Full immunoblotting and quantification of representative images are shown in Supplementary Figure S6.
