Figure 1.

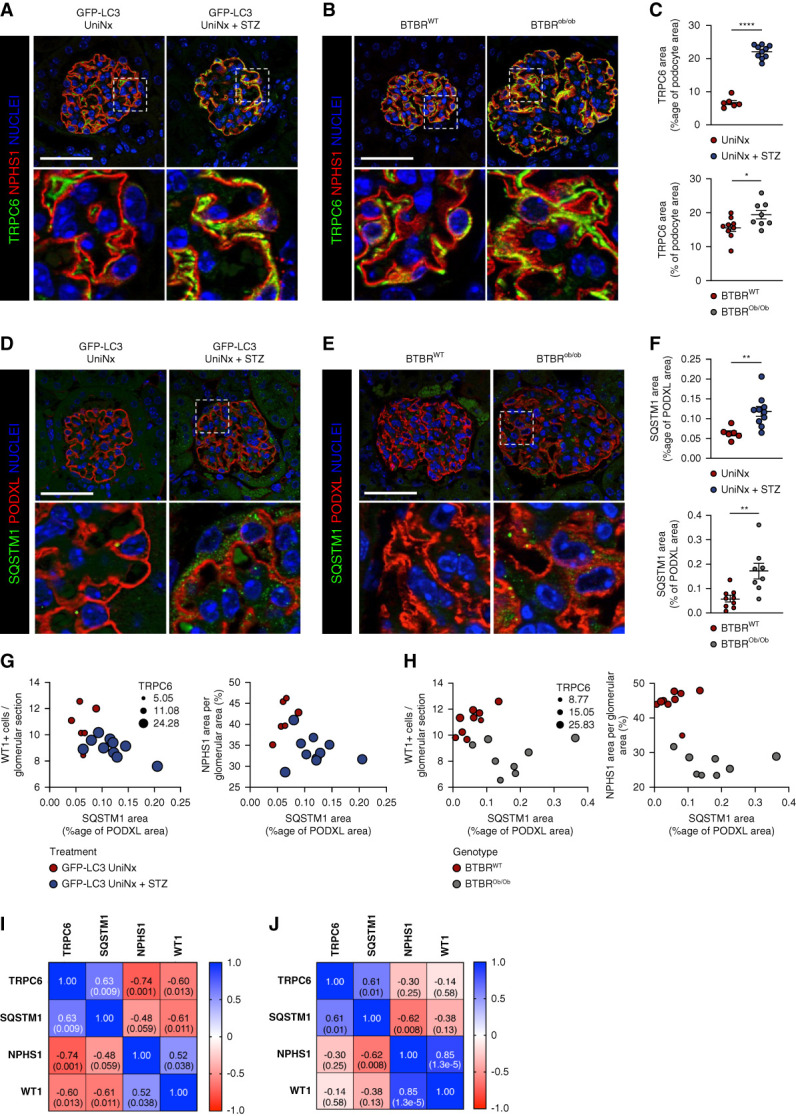
Increased TRPC6 expression and podocyte autophagy flux blockade in diabetic kidney disease. (A and B) Representative immunofluorescence images of TRPC6 (green) and NPHS1 (red) expression in the glomerulus from GFP-LC3 UniNx mice and GFP-LC3 UniNx+STZ mice (A) and from BTBRWT and BTBROb/Ob mice at 12 weeks of age (B). Nuclei are stained in blue with Hoechst. Scale bar: 50 μm. (C) Quantification of the TRPC6-positive area within the NPHS1 area in type I and type II diabetes models showing increased TRPC6 expression in DKD. n=6 GFP-LC3 UniNx, n=10 GFP-LC3 UniNx+STZ, n=9 BTBRWT, n=8 BTBROb/Ob mice. Values are presented as individual plots and mean±SEM. Unpaired t test: ****P < 0.0001 for GFP-LC3 UniNx versus GFP-LC3 UniNx+STZ and *P = 0.047 for BTBRWT versus BTBROb/Ob. (D and E) Representative immunofluorescence images of SQSTM1 (green) and podocalyxin/PODXL (red) expression in the glomerulus from GFP-LC3 UniNx mice and GFP-LC3 Unix+STZ mice (D) and from BTBR WT and BTBROb/Ob mice at 12 weeks of age (E). Nuclei are stained in blue with Hoechst. Scale bar: 50 μm. (F) Quantification of the SQSTM1 area within the PODXL area in type I and type II diabetes models showing increased SQSTM1 expression in DKD. n=6 GFP-LC3 UniNx, n=10 GFP-LC3 UniNx+STZ, n=9 BTBRWT, n=8 BTBROb/Ob mice. Values are presented as individual plots and mean±SEM. Unpaired t test: **P = 0.006 for GFP-LC3 UniNx versus GFP-LC3 UniNx+STZ and **P = 0.009 for BTBRWT versus BTBROb/Ob. (G–H) Multivariate representation of glomerular SQSTM1 area, NPHS1 area, WT1+ cells, and TRPC6 area in GFP-LC3 UniNx and GFP-LC3 UniNx+STZ mice (G) and in BTBR WT and BTBROb/Ob mice at 12 weeks of age (H). (I and J) Correlation matrix of the glomerular areas of SQSTM1, TRPC6, and NPHS1 in GFP-LC3 UniNx and GFP-LC3 UniNx+STZ mice (I) and in BTBR WT and BTBROb/Ob mice at 12 weeks of age (J). Numbers in squares represent Pearson r (P value). *P < 0.05, **P < 0.01, and ****P < 0.0001. Podocyte dedifferentiation and loss in mouse models of DKD are closely associated with the raises in podocyte TRPC6 and SQSTM1 expressions. Podocyte accumulation of SQSTM1 also correlates with podocyte TRPC6 raise in DKD models.
