
Figure 2.
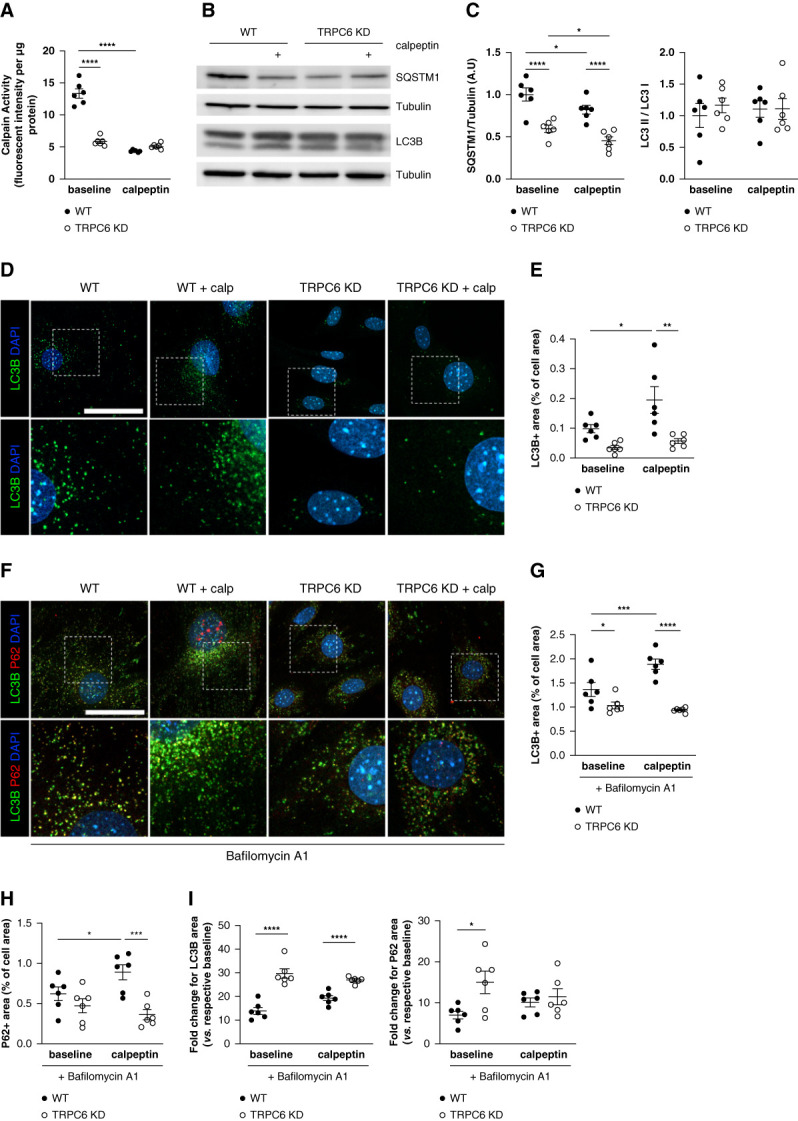
Calpain inhibition and TRPC6 KD enhance autophagic flux in vitro through decreased calpain activation. (A) Calpain activity measured in WT and TRPC6 KD MPC-5 podocytes in the absence or presence of the calpain inhibitor calpeptin (48 hours at 1 μM) normalized to protein content per sample. Two-way analysis of variance: treatment, ****P < 0.0001; phenotype, ****P < 0.0001. Tukey multiple comparison test: ****P < 0.0001 for baseline WT versus baseline TRPC6 KD, ****P < 0.0001 for baseline WT versus calpeptin WT. TRPC6 KD podocytes exhibit lower calpain activity than WT podocytes, within a similar range to podocytes treated with a calpain inhibitor. (B–C) Western blot analysis of the expression of SQSTM1/P62 and LC3B in MPC-5 WT and TRPC6 KD podocytes in the absence or presence of calpeptin (1 μM) for 48 hours and associated quantification. TRPC6 KD cells and calpeptin-treated cells have less SQSTM1/P62 abundance than WT podocytes, suggesting increased autophagy flux in these cells. Representative of n=6 replicates per condition. Protein expression was normalized to the tubulin level. Two-way analysis of variance for SQSTM1: treatment, **P = 0.008; phenotype, ****P < 0.0001. Tukey multiple comparison test: ****P < 0.0001 for baseline WT versus baseline TRPC6 KD, ****P < 0.0001 for calpeptin WT versus calpeptin TRPC6 KD, *P = 0.038 for baseline WT versus calpeptin WT, *P = 0.038 for baseline TRPC6 KD versus calpeptin TRPC6 KD. Two-way analysis of variance for LC3 II/LC3 I: treatment, P = 0.89; phenotype, P = 0.59. (D–E) Representative immunofluorescence images of LC3B (green) in WT and TRPC6 KD MPC-5 podocytes treated or not with calpeptin for 48 hours and associated quantification. TRPC6 KD and calpeptin-treated cells have a lower number of LC3+ dots per cell. Nuclei were stained with Hoechst (blue). Scale bar: 50 μm. Images are representative of n=6 replicates per condition. Two-way analysis of variance: treatment, *P = 0.02; phenotype, ***P = 0.0005. Tukey multiple comparison test: P = 0.28 for baseline WT versus baseline TRPC6 KD, **P = 0.003 for calpeptin WT versus calpeptin TRPC6 KD, *P = 0.047 for baseline WT versus calpeptin WT, P = 0.62 for baseline TRPC6 KD versus calpeptin TRPC6 KD. (F–H) LC3B (green) and SQSTM1 (red) immunofluorescences in WT and TRPC6 KD MPC-5 podocytes treated or not with calpeptin for 48 hours and associated quantification. Cells were treated with bafilomycin A1 for 4 hours to block lysosomal acidification and autophagosome–lysosome fusion. Nuclei were stained with Hoechst (blue). Scale bar: 50 μm. Images are representative of n=6 replicates per condition. Two-way analysis of variance for LC3B: treatment: *P = 0.0378; phenotype: ****P < 0.0001. Tukey; interaction: **P = 0.004 multiple comparison test: *P = 0.03 for baseline WT versus baseline TRPC6 KD, ****P < 0.0001 for calpeptin WT versus calpeptin TRPC6 KD, ***P = 0.001 for baseline WT versus calpeptin WT, P = 0.49 for baseline TRPC6 KD versus calpeptin TRPC6 KD. Two-way analysis of variance for SQSTM1: treatment: P = 0.35; phenotype: ***P < 0.0006; interaction: *P = 0.03. Tukey multiple comparison test: P = 0.22 for baseline WT versus baseline TRPC6 KD, ***P = 0.0002 for calpeptin WT versus calpeptin TRPC6 KD, *P = 0.03 for baseline WT versus calpeptin WT, P = 0.36 for baseline TRPC6 KD versus calpeptin TRPC6 KD. Calpeptin treatment induces SQSTM1+ and LC3+ dot accumulation in WT podocytes, showing that calpain activation inhibition increases the autophagy flux in podocytes. (I) Fold change expression for LC3B and SQSTM1 in bafilomycin A1 condition compared with non–bafilomycin A1 condition. Multiple unpaired t test Holm-Sidak method. For LC3B: WT bafilomycin A1 versus TRPC6 KD bafilomycin A1 ****P < 0.0001; WT bafilomycin A1 calpeptin versus TRPC6 KD bafilomycin A1 calpeptin ****P < 0.0001. For SQSTM1: WT bafilomycin A1 versus TRPC6 KD bafilomycin A1 *P = 0.02; WT bafilomycin A1 calpeptin versus TRPC6 KD bafilomycin A1 calpeptin P = 0.55. Whereas TRPC6 KD cells showed less LC3+ dots at baseline, bafilomycin A1 treatment unmask the higher autophagy flux in these cells with a higher fold change in LC3+ dots and SQSTM1+ dots number when compared with WT podocytes.