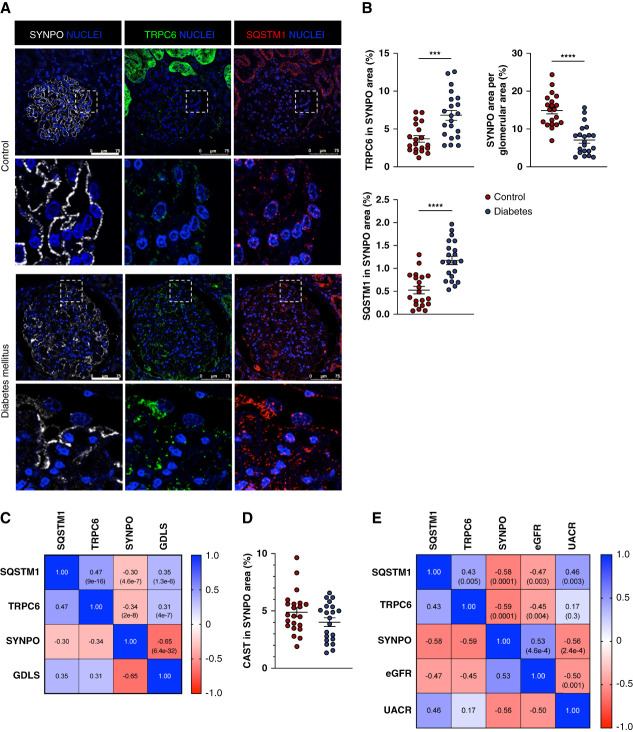
Figure 6.
TRPC6 expression, autophagic flux assessment, and podocyte injury in patients with diabetic kidney disease. (A) Representative immunofluorescence of SYNPO (white), TRPC6 (green), and SQSTM1 (red) expression in the glomerulus from controls and patients with diabetes. Nuclei are stained in blue with Hoechst. Scale bar: 75 μm. (B) Quantifications of SYNPO, TRPC6, SQSTM1, and CAST expressions. Values are presented as individual plots of each patient and mean±SEM. **P < 0.01, ***P < 0.001, ****P < 0.0001. SYNPO and CAST expressions are low in patients with diabetes while TRPC6 expression increases and SQSTM1 accumulates in podocytes. (C) Correlation matrix of the glomerular areas of SQSTM1, TRPC6, and SYNPO and the glomerular diabetic lesion score (GDLS) in patients by individual glomerulus. Numbers in squares represent Pearson r (P value). (D) Quantifications of CAST expression in glomeruli. Values are presented as individual plots of each patient and mean±SEM. (E) Correlation between the mean glomerular expression of SQSTM1, TRPC6, and SYNPO and biologic parameters of patients (eGFR and UACR). Numbers in squares represent: Pearson r (P value); glomerular diabetic lesion score; UACR, urinary albumin-to-creatinine ratio.

