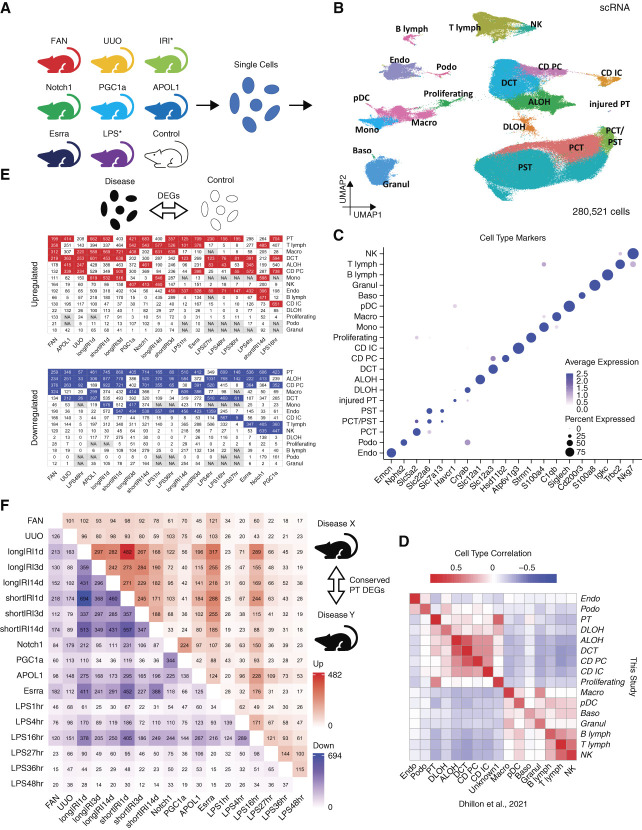
Figure 1.
Single-cell RNA-seq atlas of mouse kidney disease models. (A) Mouse kidney models used to generate the scRNA-seq atlas: APOL1, Apol1 transgenic; Control, wild-type control; Esrra, Esrra knockout; FAN, folic acid nephropathy; IRI, ischemia reperfusion injury; LPS, endotoxin (LPS) injection; Notch1, Notch1 transgenic; PGC1a, Pgc1a transgenic; UUO, unilateral ureteral obstruction. Note, IRI contains long and short IRI samples collected 1, 3, and 14 days after the ischemia; LPS contains samples obtained at 1, 4, 16, 27, 36, and 48 hours after the LPS injection. (B) UMAP of 280,521 mouse kidney single cells. Nineteen cell types were identified: ALOH, ascending loop of Henle; B lymph, B lymphocyte; Baso, basophile; CD IC, collecting duct intercalated cell; CD PC, collecting duct principal cell; DCT, distal convoluted tubule; DLOH, descending loop of Henle; Endo, endothelial cell; Granul, granulocyte; injured PT, injured proximal tubule; Macro, macrophage; Mono, monocyte; NK, natural killer cell; PCT, proximal convoluted tubule; pDC, plasmacytoid dendritic cell; Podo, podocyte; Proliferating, proliferating cell; PST, proximal straight tubule; T lymph, T lymphocyte. (C) Dot plot of cell type–specific marker genes (dot size denotes percentage of cells expressing the marker, and color scale represents average gene expression values). (D) Heatmap showing Pearson correlation coefficients of averaged cell type gene expression between mouse kidney scRNA-seq atlas generated in this study and a published mouse scRNA-seq dataset with control and FAN kidney samples.3 (E) Numbers of upregulated (top) and downregulated (bottom) cell type–specific DEGs (disease versus control). NA (i.e., not applicable) means not enough cells in either disease or control groups for DEG identification. Within each mouse model, the four cell types having the most upregulated and downregulated DEGs are highlighted in red and blue, respectively. (F) Heatmap showing the numbers of upregulated (upper triangle) and downregulated (lower triangle) cell type–specific DEGs (against the control) conserved between any two studied mouse kidney disease models in PT cells. Figure 1 can be viewed in color online at www.jasn.org.

