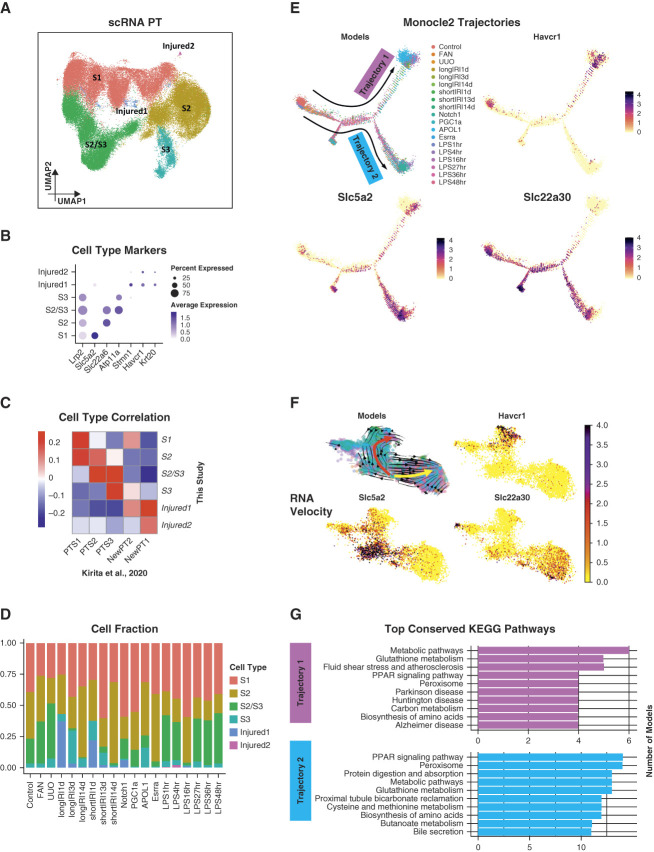
Figure 4.
Conserved pathway activities in PT cells across different mouse disease models. (A) UMAP of 70,501 PT cells from the mouse scRNA-seq data. Among the resultant cell clusters, we identified the three key PT segments: S1 (featured by the expression of Slc5a2), S2 (featured by the expression of Slc22a6), S3 (featured by the expression of Atp11a), and a cluster of S2 and S3 cells (featured by the coexpression of Slc22a6 and Atp11a). The remaining clusters were injured PT cells (i.e., Injured1 and Injured2), featured by the coexpression of Havcr1 and Krt20 and lower expression of canonical PT markers (e.g., Lrp2). (B) Dot plot of cell type–specific marker genes (dot size denotes percentage of cells expressing the marker, and color scale represents average gene expression values). (C) Heatmap showing Pearson correlation coefficients of averaged PT cell subtype gene expression between mouse kidney scRNA-seq atlas generated in this study and a published mouse snRNA-seq dataset with control and IRI kidney samples.9 (D) Bar plot showing the PT subtype cell fractions in each mouse kidney model of the scRNA-seq data. (E) Trajectory analysis of PT cells. The trajectories were calculated using Monocle 2.29 All four panels show the same trajectories. The top left panel indicates the location of the cells along the trajectories for mouse kidney models. The remaining panels show the expression of PT cell subtype marker genes along the trajectories. (F) RNA velocity analysis of PT cells. The RNA velocity was predicted using scVelo.31 The top left panel identifies two main trajectories, indicated by the red and yellow arrows, respectively. It also shows the cell location along the trajectories for mouse kidney models, using the same color scheme as (E). The remaining panels illustrate the expression of PT cell subtype marker genes along the trajectories. (G) Bar plots showing the top conserved KEGG pathways among the mouse kidney models in each identified Monocle 2 trajectory. Figure 4 can be viewed in color online at www.jasn.org.

