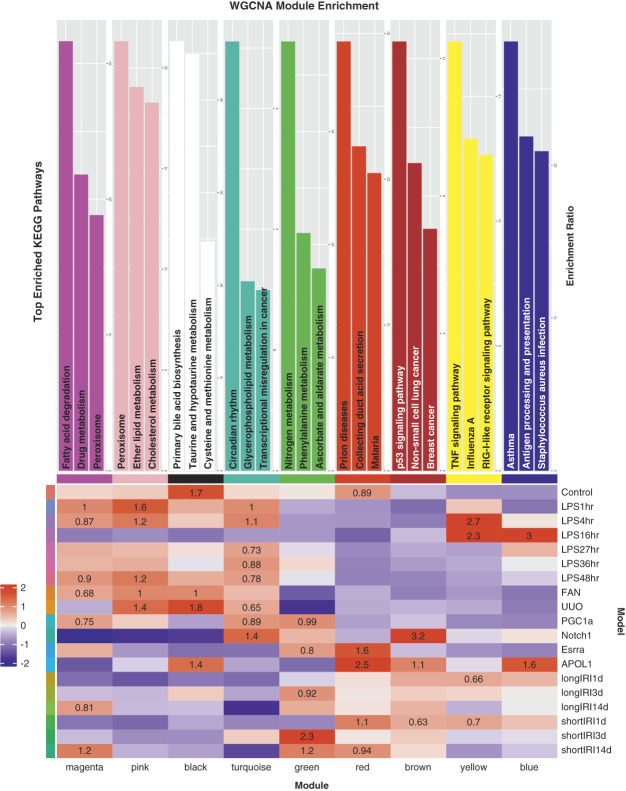
Figure 5.
Weighted gene coexpression network analysis of PT cells. The heatmap (bottom) demonstrates high WGCNA module association and conservation among the mouse kidney models. The bar plots (top) show the top KEGG pathways enriched in each identified WGCNA module. Figure 5 can be viewed in color online at www.jasn.org.

