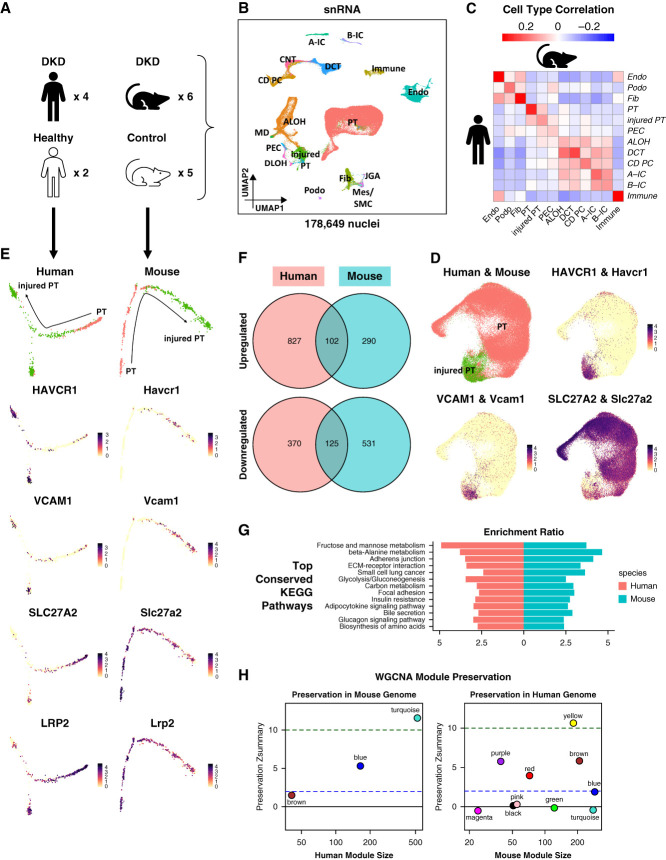
Figure 6.
Human and mouse DKD snRNA-seq atlas. (A) Human and mouse samples used to generate the human and mouse DKD snRNA-seq atlas. (B) UMAP of 54,945 human and 123,704 mouse kidney single nuclei. This was generated by integrating human and mouse snRNA-seq data. Eighteen cell types were identified: A-IC, alpha intercalated cell; ALOH, ascending loop of Henle; B-IC, beta intercalated cell; CD PC, collecting duct principal cell; CNT, connecting tubule; DCT, distal convoluted tubule; DLOH, descending loop of Henle; Endo, endothelial cell; Fib, fibroblast; Immune, immune cell; injured PT, injured proximal tubule; JGA, juxtaglomerular apparatus; MD, macular densa; Mes, mesangial cell; PEC, parietal epithelial cell; Podo, podocyte; PT, proximal tubule; SMC, smooth muscle cell. (C) Heatmap showing Pearson correlation coefficients of averaged cell type gene expression between human and mouse kidney snRNA-seq data. Each row represents a cell type in the human data, and each column represents a cell type in the mouse data. (D) Integration of 19,319 human and 70,125 mouse PT and injured PT nuclei. The top left panel shows the resultant UMAP. The remaining panels are feature plots showing the expression of PT and injured PT marker genes. (E) Trajectory analysis of human and mouse PT nuclei. The trajectories were calculated using Monocle 2.29 Panels on the left column were generated using the human data, while panels on the right column were generated using the mouse data. Panels on the top row indicate the location of PT and injured PT nuclei along the trajectories, while the remaining panels illustrate the expression of PT and injured PT marker genes along the trajectories. (F) Venn diagrams showing the numbers of upregulated (top) and downregulated (bottom) genes along the trajectories that were conserved between the human and mouse data. (G) Bar plot showing the top conserved KEGG pathways between the human and mouse data along the trajectories. (H) Preservation Zsummary statistics of human WGCNA modules in the mouse data (left) and mouse WGCNA modules in the human data (right). Each point represents a module. Point color reflects the module color. Points are labeled by their respective colors. Blue and green lines depict the rough thresholds for weak (Z=2) and strong (Z=10) evidence of module preservation. Figure 6 can be viewed in color online at www.jasn.org.

