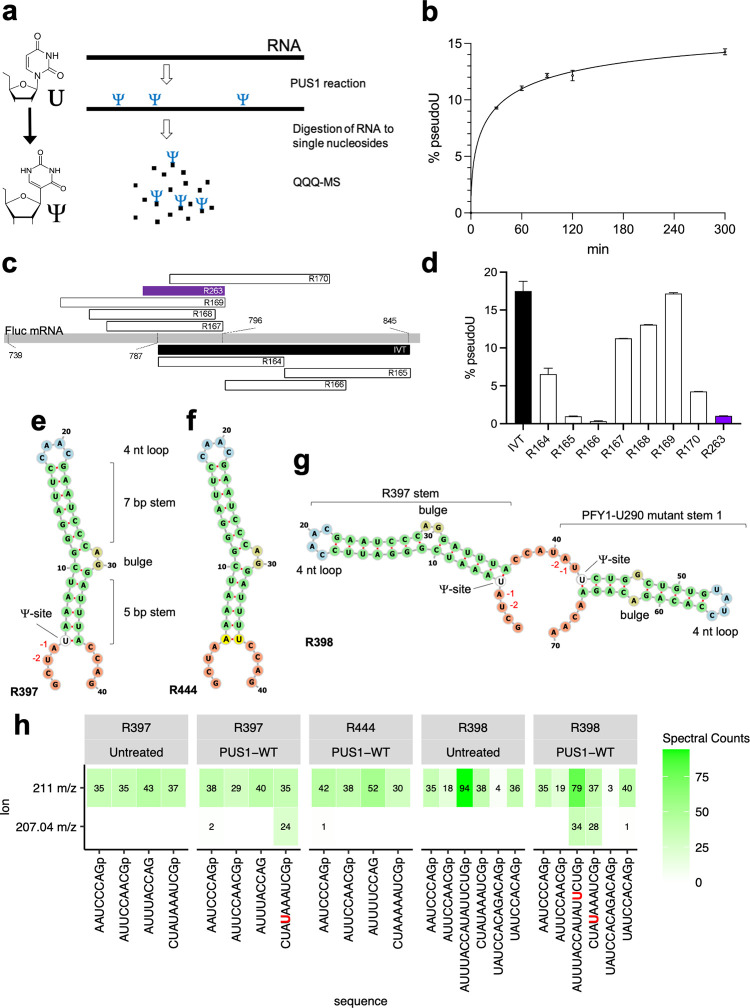
Fig 1. Determination of a suitable RNA substrate for crystallization with PUS1.
(a) Schematic representation of the PUS1 activity assay and analysis (the chemical structures of U and Ψ are provided to the left) (b) PUS1 was incubated with firefly luciferase (Fluc) mRNA. The graph shows percent of uridine-to-Ψ conversion (% pseudoU) over time in minutes from two independent experimental replicates in a non-linear fit, four parameter logistic (4PL) sigmoidal curve. Reactions were stopped after 30/60/90/120/300 minutes and analyzed via LC-MS/MS. (c) Schematic view of synthetic RNA oligos and a short in vitro transcribed RNA covering Fluc positions 760 to 845. The names of the substrates are shown inside the bars. (d) Percent of uridine-to-Ψ conversion as determined by LC-MS/MS of the RNA oligos by PUS1 after incubation for two hours. Each data set contains at least two replicas. RNA secondary structure predictions [48] of RNA substrates R397 (e), R444 (f), and R398 (g). The predicted pseudouridylation site, the positions of the H (- 2) and R (- 1) nucleotide in relation to the pseudouridylation site, and RNA structure features are indicated. The nucleotides are colored according to the type of structure that they are in (green: stems (canonical helices), yellow: interior loops, blue: hairpin loops, orange: 5’ and 3’ unpaired region). (h) Heatmaps of the number of oligonucleotide spectra identified by LC-MS/MS analysis in a RNase T1 digest of RNA substrates after incubation with PUS1 indicated above the heatmaps. Shown are the characteristic 207.04 m/z Ψ nucleoside signature ion (bottom) or the 211.00 m/z ribose phosphate ion (top).

