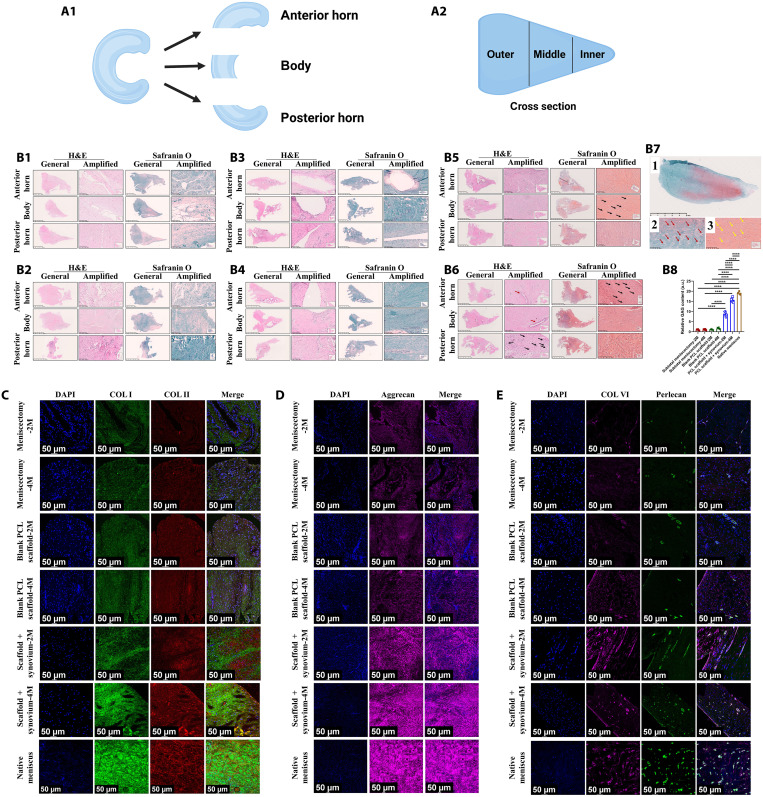
Fig. 3. 3D printing scaffold combining autologous synovium transplant facilitates anisotropic meniscal regeneration from histological view in porcine subtotal meniscectomy model.
(A) Schematics of meniscus segmentation for subsequent histological analysis [(A1) from anterior to posterior, meniscus tissue is divided into anterior horn, body, and posterior horn; (A2) from inner to outer, meniscus tissue is divided into inner, middle, and outer zones]. (B) Histological analysis of regenerated tissue and native meniscus [(B1) subtotal meniscectomy group, 2 months; (B2) subtotal meniscectomy group 4 months; (B3) blank PCL scaffold group 2 months; (B4) blank PCL scaffold group 4 months; (B5) PCL scaffold + synovium transplant group 2 months, black arrows represent regenerative fibrochondrocyte-like cells; (B6) PCL scaffold + synovium transplant group 4 months, black arrows represent regenerative fibrochondrocyte-like cells, red arrows represent blood vessels; (B7) Safranin O–fast green staining of native menisci, 1, Safranin O–fast green staining; 2, red arrows represent native meniscal fibrochondrocytes; 3, yellow arrows represent regenerative fibrochondrocyte-like cells in regenerated tissue of PCL scaffold + synovium transplant group; (B8) the semiquantitative assessment of GAG, 2M, 2 months postoperatively; 4M, 4 months postoperatively; n = 3 for native meniscus; n = 6 for other groups; one-way analysis of variance (ANOVA)]. (C) Representative images of COL I and COL II immunofluorescence in regenerated tissue and native meniscus. (D) Representative images of aggrecan immunofluorescence in regenerated tissue and native meniscus. (E) Representative images of perlecan and COL VI immunofluorescence in regenerated tissue and native meniscus. ****P < 0.0001; a.u., arbitrary units.

