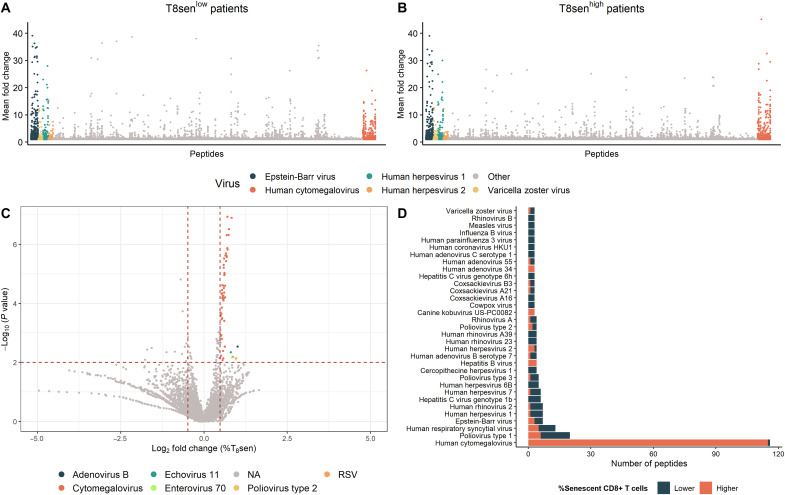
Fig. 2. CMV is the main driver of T8sen accumulation in patients with aNSCLC.
Pan-virus serological profile (VirScan) was assessed in the serum of 176 patients with aNSCLC. (A and B) Scatter plots representing the mean enrichment of antipeptide antibodies in T8senlow (A) and T8senhigh (B) patients. (C) Volcano plot representing the mean percent of T8sen in peptide-positive patients divided by that of peptide-negative patient (fold change). Horizontal dotted line defines a P value of 0.01 (in the context of multiple testing), and the vertical dotted line represents a meaningful 40% fold change of percentage of T8sen cells between peptide-positive and peptide-negative patients (i.e., a log2 fold change = ±0.4854). (D) Number of viral peptides in which positivity is associated with a higher (orange bars) or lower (blue bars) percentage of CD8+ senescent T cells (Wilcoxon P < 0.05).

