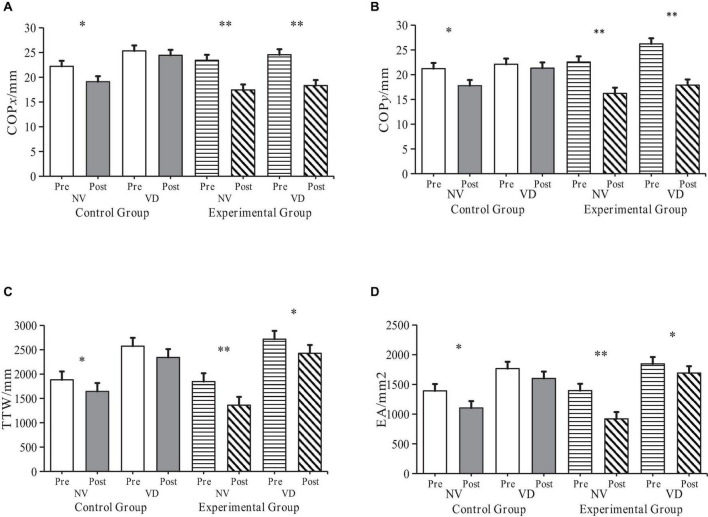
FIGURE 4.
Alterations in ASD children’s balance ability in control and experimental groups pre- and post-intervention. “NV” represents Normal Visual, “VD” represents Visual Deprivation; *p < 0.05, **p < 0.01. COPxy: Distance traversed by the Centre of Pressure (COP) on the x- and y-axis during upright standing; TTW: Total length of the COP’s moving trail; EA: Elliptical area encapsulating 95% of the COP’s moving trail. (A) COPx Changes of participants before and after intervention. (B) COPy Changes of participants before and after intervention. (C) TTW changes of participants before and after intervention. (D) EA changes of participants before and after intervention.

