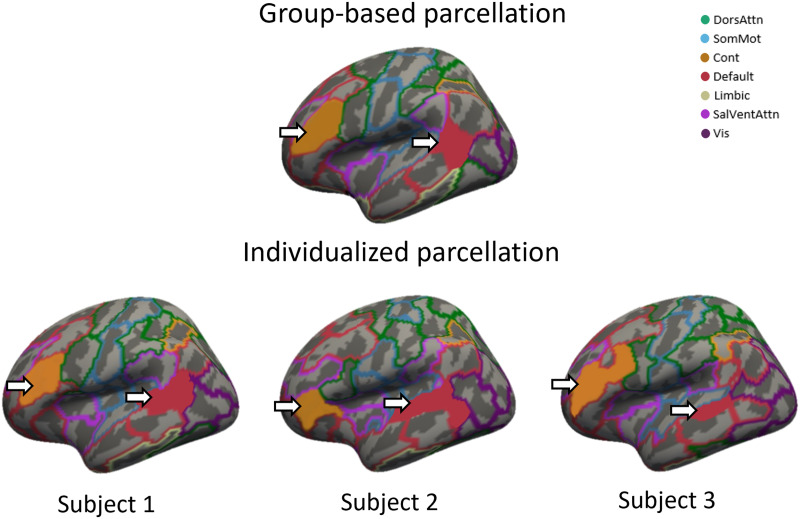
Figure 1. .
Differences in parcel boundaries between group-based and individualized parcellation. The images show different parcellations overlayed on the inflated fsaverage5 template surface of the left hemisphere, with 20,484 vertices. The top image shows the group-based parcellation, which was used as a starting point for the individualized parcellation algorithm. Colors correspond to the seven canonical functional networks that are used to group parcels in the atlas (Yeo et al., 2011). The bottom three images show individualized parcellations for three different subjects after 20 iterations of the GPIP algorithm. The region shaded in orange corresponds to region 1 in the lateral prefrontal cortex of the control network for all parcellations. The region shaded in red corresponds to region 1 in the parietal lobe of the default mode network. The same regions are present in all individuals, but their locations, sizes, and shapes show considerable variability. DorsAttn, dorsal attention network; SomMot, somatomotor network; Cont, control network; Default, default mode network; Limbic, limbic network; SalVentAttn, salience/ventral attention network; Vis, visual network.

