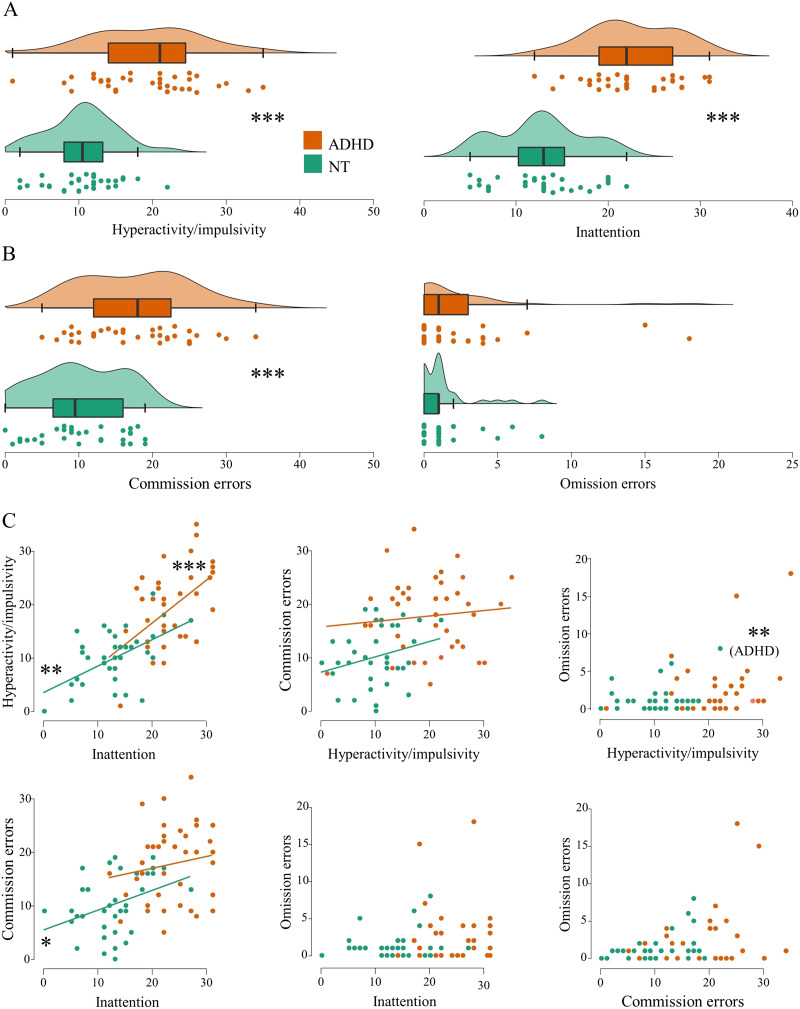
Figure 1. .
(A) ADHD symptoms and (B) number of errors in CPT-2 displayed by raincloud plots showing individual data points, density plots and box plots by group. (C) Scatter plots and regression lines of associations between ADHD symptoms and number of errors in CPT-2. Regression lines are not added to plots including omission errors, because their distributions within groups do not follow a normal distribution. ***p < .001, **p < .01, *p < .05.

