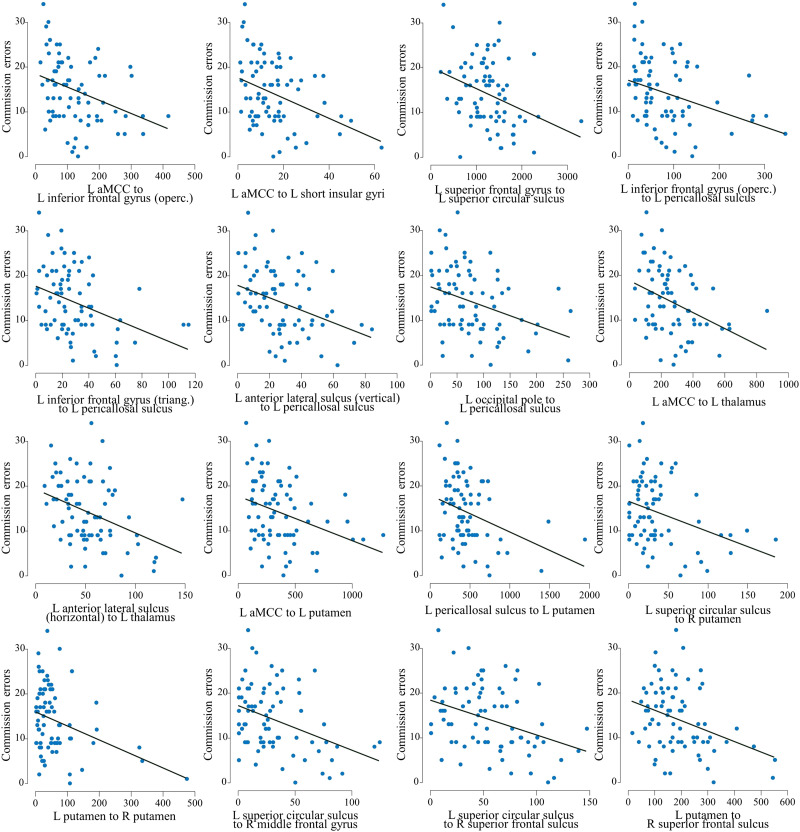
Figure 6. .
Scatter plots and regression lines of associations between the number of commission errors in CPT-2 and edge weights of the network representing hypoconnectivity associated with higher amount of commission errors in CPT-2 across all participants. L = left, R = right, aMCC = middle-anterior part of the cingulate gyrus and sulcus, operc. = opercular part, triang. = triangular part.

