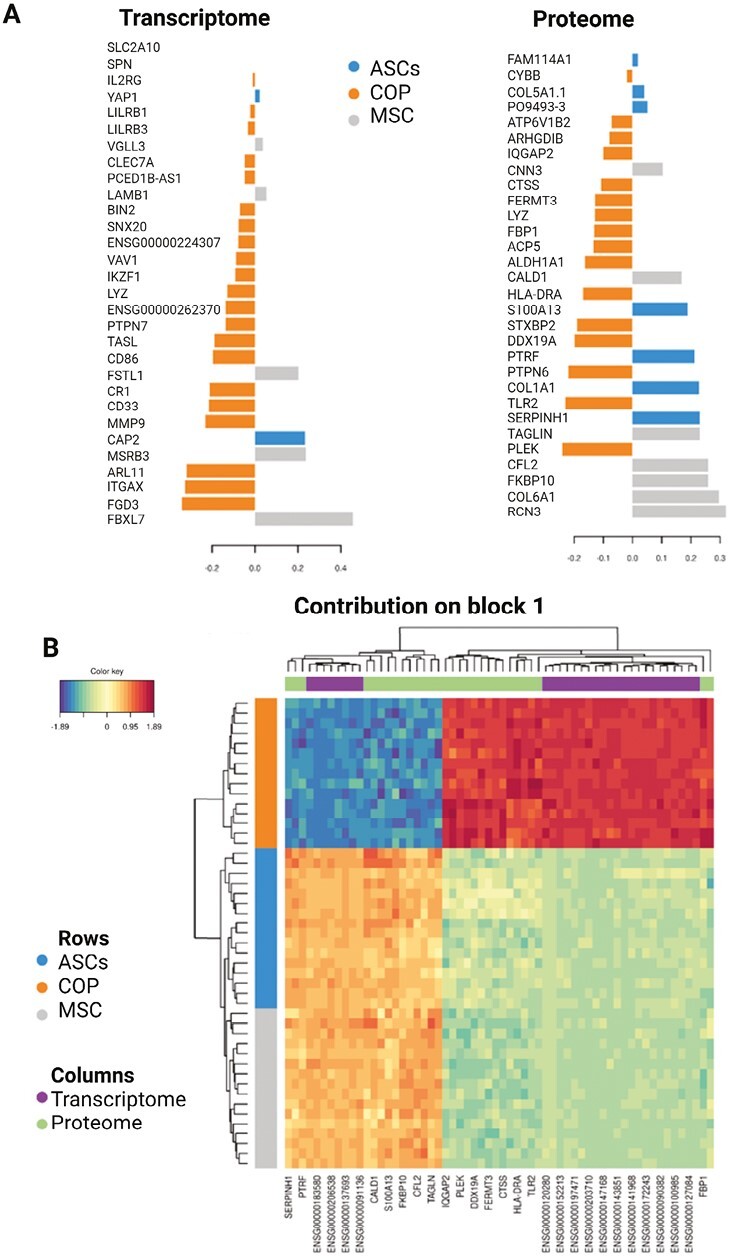
Figure 4.

Continuation of interaction results. (A) Loading plot for the variables selected by multiblock sPLS-DA performed on the cells on component 1. This plot shows the multi-omics signature on component 1, separated by data type (Proteome/Transcriptome). The most important variables (according to the absolute value of their coefficients) are ordered from bottom to top. Colors indicate the class for which the median expression value is the highest for cell type. (B) Clustered Image Map for the variables selected by multiblock sPLS-DA performed on the cells on component 1. The CIM represents samples in rows (indicated by their cell subtype on the left side of the plot) and selected features in columns (indicated by their data type at the top of the plot). According to the CIM, component 1 accurately classifies COP cells from the ASCs and MSCs with a group of overexpressed transcripts and proteins.
