Figure 5.

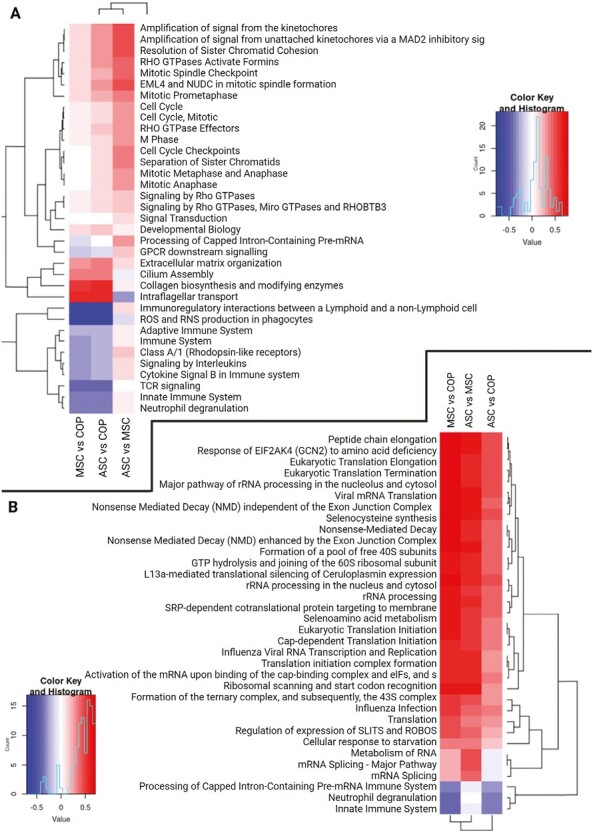
Pathway analyses for transcriptome and proteome results. Red represents enrichment of pathway, and blue represents a decrease in representation of the pathway. (A) Transcriptome pathway enrichment. (B) Proteome pathway enrichment.

Pathway analyses for transcriptome and proteome results. Red represents enrichment of pathway, and blue represents a decrease in representation of the pathway. (A) Transcriptome pathway enrichment. (B) Proteome pathway enrichment.