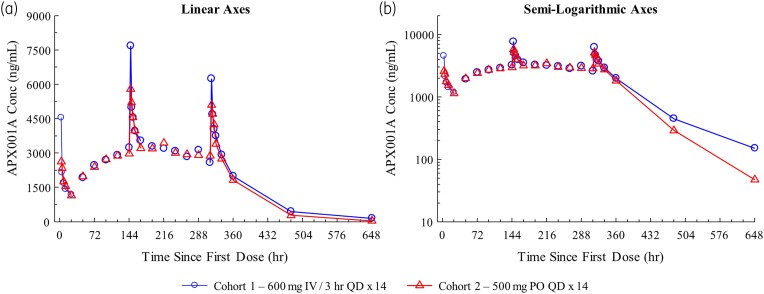
Figure 2.
Plasma concentrations (geometric mean) of MGX after IV or PO administration. Geometric mean plasma concentrations after IV or PO administration. (a) Linear representation. (b) Semi-log representation. The observed Cmax of FMGX was comparable between the IV and PO cohorts. FMGX, fosmanogepix; hr, hour; IV, intravenous; MGX, manogepix; PO, oral; QD, once a day. This figure appears in colour in the online version of JAC and in black and white in the print version of JAC.

