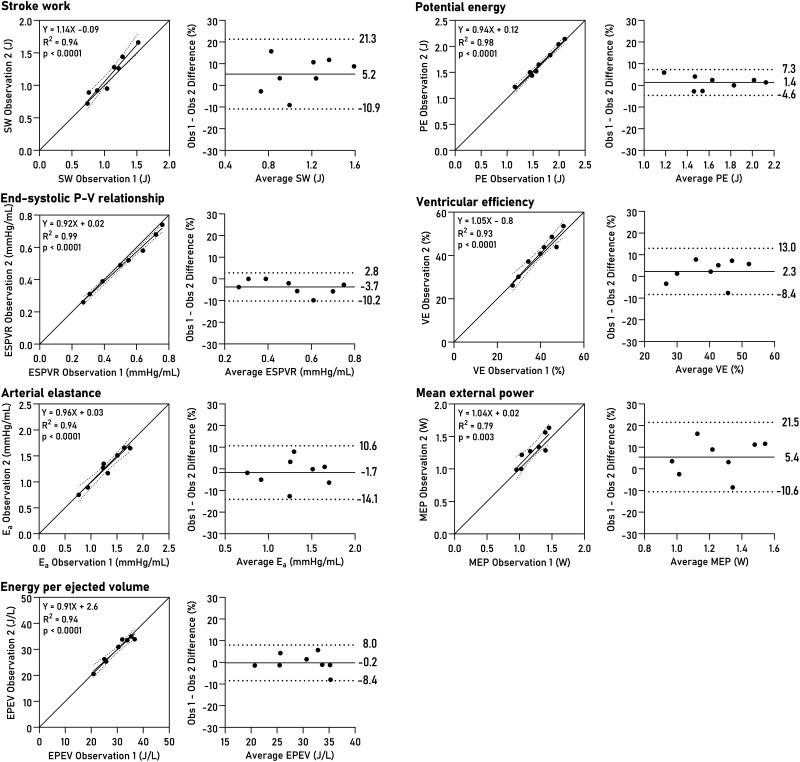
Figure 5.
Intraobserver variability for PV loop parameters. Linear regression and Bland–Altman plots show bias and limits of agreement. SW, stroke work; PE, potential energy; ESPVR, end-systolic pressure-volume relationship; VE, ventricular efficiency; Ea, effective arterial elastance; MEP, mean external power; EPEV, energy per ejected volume.

